5 results
Graphing projects on sale

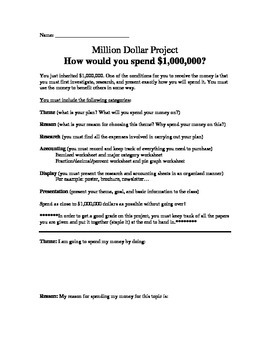
Million Dollar Project (Graphing, decimals, fractions, accounting and percents)
What would you do with a million dollars? How would you spend it?
In this project you've been left a 1 million dollar inheritance. The catch is you must first research and present how you will spend the money.
In the first part of the experiment, the students will fill out an accounting chart, where they will fill out an itemized chart displaying each item they plan on purchasing to complete their million dollar project. They will than be asked to put all those items into major categorie

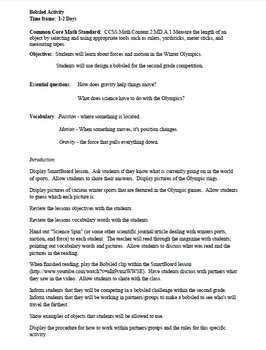
STEM Bobsled Olympic Lesson
Students are to work in groups or pairs and design a bobsled. Students will be provided with a toilet paper role, two popsicle sticks, two pipe cleaners, and 1 foot of masking tape. If students wish to brings small things from home, that is okay. Allow students to think through their design. Allow a trial run, and then allow modifications for improvement after the trail run. Hold a final event and display the gold, silver, and bronze winners for this event. This event is fun and engaging.
Subjects:
Grades:
1st - 8th
CCSS:

Stock Market in the Classroom
This assignment includes multiple areas of the math curriculum. These include: number sense and numeration (mathematical computation), data management (graphing), and transformational geometry.
Over a 10-day period students will select one stock to invest in and track. Using the included investment tracker your students will record how their stock is performing. They will keep records of, and show all of their work and mathematical calculations. They will also provide visual representations of
Grades:
6th - 8th
Types:

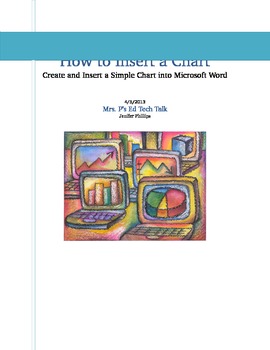
How to Insert a Chart: Microsoft Word
This step by step tutorial shows you how to create and insert a simple chart into Microsoft Word; simple enough for upper elementary students
Grades:
4th - 6th, Adult Education, Staff
Types:

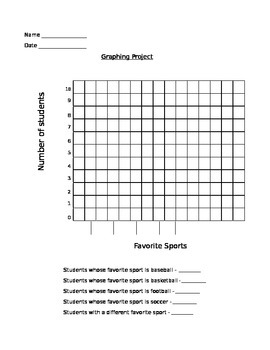
Graphing - Cooperative In-class Graphing Project
This worksheet is designed to help students improve their graphing abilities. They will first collect data from their classmates' favorite sports and create a bar graph based on the findings. On the other side, students will also collect data on their classmates' hair color and produce a bar graph. Both graphs will include information on the x-axis and y-axis, and students will fill in the corresponding bars.
Subjects:
Grades:
3rd - 6th
Types:
Showing 1-5 of 5 results


