32 results
Higher education Common Core HSS-ID.A.1 activities
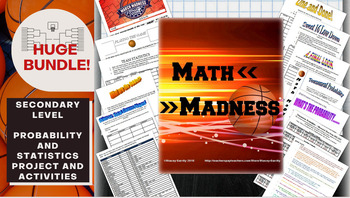
Math March Madness Full Tournament Project {BUNDLE}
Harness the excitement of NCAA March Madness with this huge project for secondary math teachers that follows all stages of the tournament! This Common Core aligned bundle comes with bonus parts not sold individually in my store so you can create a rich immersion in the tournament, practice probability and statistics and learn some interesting new ones along the way! Save $3 plus get bonus content by bundling!You can pick and choose which parts you would like to incorporate, or follow my schedu
Subjects:
Grades:
6th - 12th, Higher Education
Types:
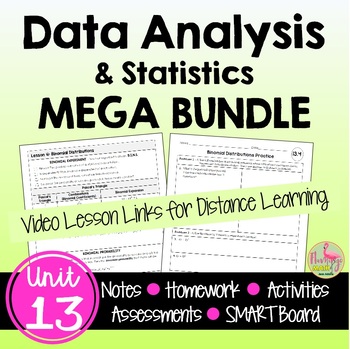
Data Analysis and Statistics MEGA Bundle (Algebra 2 - Unit 13)
This is a MEGA Bundle of GUIDED NOTES WITH VIDEO LESSONS for your distance learning needs, homework, daily warm-up, content quizzes, mid-unit and end-unit assessments, review assignments, and cooperative activities for Algebra 2 Honors UNIT 13: DATA ANALYSIS & STATISTICS. #distancelearningtpt⭐Guided Student Notes⭐ 8-Page-Bound-Book-Style Foldables⭐ Google Slides®⭐ Fully-editable SMART Board® Slides⭐ Homework/Practice assignment⭐ Lesson Warm-Up (or exit ticket)⭐Daily Content Quiz (homework ch
Subjects:
Grades:
8th - 11th, Higher Education
CCSS:
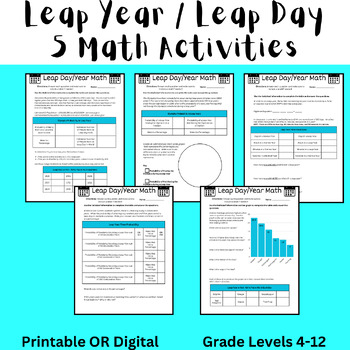
Leap Day (Leap Year) 2024 Math Activity (Algebra and Data) Digital or Printable
These 5 activities are fun NO PREP math activities to do to celebrate Leap Day 2024 (Leap Year 2024). The activities can be completed as 5 separate pages or as a 5 page packet. There is a customizable digital resource (Google Document) and a printable resource (Canva) that contain the same directions and activity. This was designed for students in middle school, but could be used for upper elementary and high school students in Pre Algebra, Pre-Algebra, or Algebra. In this assignment, students
Subjects:
Grades:
4th - 12th, Higher Education, Adult Education
Types:
Also included in: Leap Year (Leap Day) 2024 Bundle - Math, Reading, Writing, and Trivia
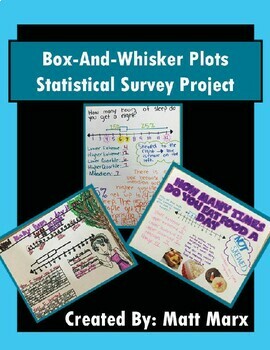
Box And Whisker Plots - Statistical Survey Project
Box-And-Whisker Plots - Statistical Survey ProjectThis Statistical Survey Project offers students the opportunity to demonstrate an understanding of Statistics content through the lens of a personalized statistical survey and the creation/study of a Box-And-Whisker Plot.Students insert themselves into their learning by selecting their own personalized survey question. Students have fun creating their posters, sharing them with the class, and having them displayed for all to see in the classroom.
Subjects:
Grades:
6th - 12th, Higher Education, Adult Education
Types:
CCSS:
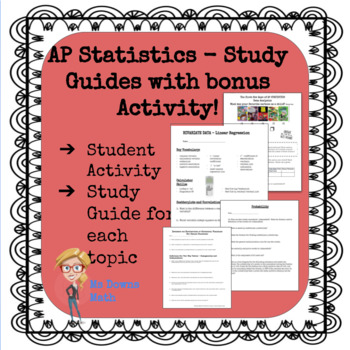
AP Statistics Study Guides - All Topics!
There is a pdf file study guide for each topic in the AP Statistics curriculum. Exploring Data, Normal Distributions, Linear Regressions, Experiments and Designing Studies, Probability, Random Variables, Sampling Distributions, Confidence Intervals, Hypothesis Tests, Comparing Populations, Chi Square Procedures, and Inference about Regression. I have students complete one for each unit. At the end of the year, they have a great study packet for the AP Exam! Student feedback has indicated that th
Subjects:
Grades:
9th - 12th, Higher Education, Adult Education
Types:
CCSS:
TI-84 Plus Graphing Calculator Training
Learn the features of the Texas Instruments TI-83 Plus Graphing Calculator.This resource contains 16 handouts with examples, directions, screenshots, keystrokes and extra practice (with answer keys) for 16 topics:Solving EquationsCreating GraphsScatterplotsTable FeaturesList FeaturesRegression EquationsMatrix EquationsTransforming GraphsEvaluating FunctionsResidualsGraphing Piecewise FunctionsAnalyze FunctionsOne Variable StatisticsStoring FeaturesCreating PolygonsGraphing InequalitiesUse this r
Grades:
7th - 12th, Higher Education, Adult Education
CCSS:
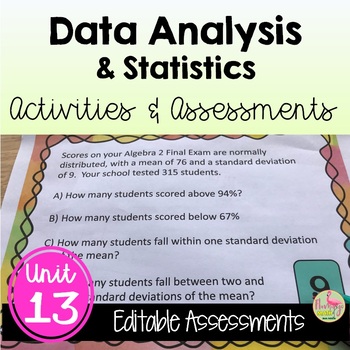
Data Analysis Activities and Assessments (Algebra 2 - Unit 13)
Data Analysis & Statistics Activity and Assessment Bundle:This resource is a bundled set of content quizzes, mid-unit quizzes, reviews, a station activity and two unit tests, both short response and multiple choice style. All keys are included in the unit bundle on Data Analysis & Statistics. The unit is designed to cover the material in-depth and to challenge your Algebra 2 Honors students.Additional Practice Assignments or Homework:6 Daily Quizzes (two forms each day)☑ Measures of Cent
Subjects:
Grades:
8th - 11th, Higher Education
Types:
CCSS:
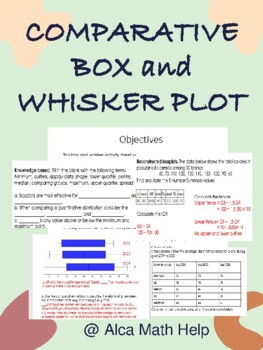
Comparison Box and Whisker Plots Worksheet, Quiz, Test for Stats & AP Stats
This box and whisker activity sheet was designed to test students understanding of the 5 number summary data values given quantitative data sets. Perfect for students in grade 10-12 doing statistics and you want to give them a challenge and should be manageable for students doing AP STATSAt the end of this activity students should be able to1. Students should be able to explain and construct box plots showing the different regions and what they represent. 2. Students should also be able to use
Subjects:
Grades:
11th - 12th, Higher Education, Adult Education, Staff
CCSS:
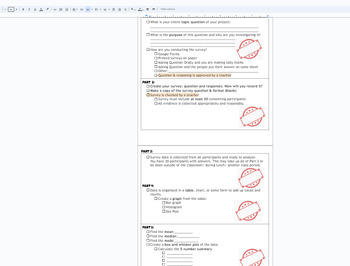
Statistics Survey project Discovery (broken down into sections) with Rubric
This is a broken down (scaffolded) packet of instructions/ guide for a Stats Project for Math 1 HS or 8th grade students. The goal of the project is for students to take a statistical survey on quantitative data (numbers) of their choice. Using this data from the survey, the following will be included in the project:Survey- the question being askedSurvey responses (requirement of 30)Data organization: Bar chart, Histogram, Dot PlotMeanMedianModeBox and Whisket Plot5 number summary (Q1,Q2,Q3, min
Subjects:
Grades:
7th - 12th, Higher Education, Adult Education
CCSS:
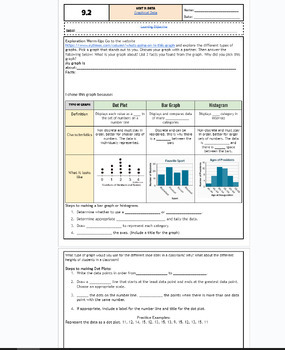
Graphical Data: Bar Charts, Dot Plots and Histograms fillable notes UPDTD
Unit 9: Data and Stats: UpdatedUpdated9.2 Graphs: bar, dot plot, histpgramStudents go over the vocabulary and define each type fo graph and what data fits for each graph. The warm up is an exploratory activity where students go on a website to search for their graph of interest and discuss the key findings. This takes around 10-15 mins and students enjoyed it! Notes are scaffolded. Includes hook video hyperlinked on the "learning objective" title. Key is included and hyperlinked as a PDF in the
Subjects:
Grades:
6th - 12th, Higher Education, Adult Education
CCSS:
Also included in: Unit 9: Data and Statistics Fillable Notes
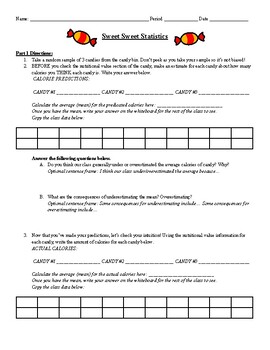
Halloween / Fall Statistics Class Activity for Box Plots and Five Number Summary
Hello!If you're looking for a fun and engaging activity for your Statistics Class this Halloween or fall season, this activity is great! My students enjoy getting the opportunity to eat candy as they work on some real-world statistical applications. The activity requires students to collect data, share data with their peers, and analyze the data. They will be working on creating a five number summary and analyzing/drawing box plots. You will need to purchase candy for this activity. Please reach
Subjects:
Grades:
9th - 12th, Higher Education
CCSS:
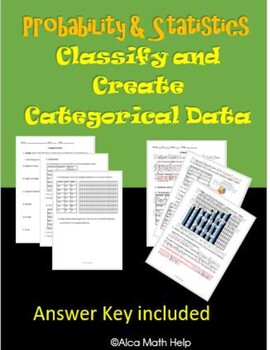
Categorical Data in Statistics (Classify & Create)- CP Stats, HW, CW, Worksheet
If you are looking for an easy to follow for students. You are at the right place. This is a quick and easy to follow activity sheet that brings across the concept clearly and precisely. Teachers in my department love this activity sheet. This is useful for CP Probability and Statistics, AP Statistics and Algebra 1 statistics unit.Categorical data and Display Variables ObjectivesAt the end of the lesson students should be able to:1. Correctly define categorical and quantitative data with exampl
Subjects:
Grades:
8th - 12th, Higher Education, Adult Education, Staff
Types:
CCSS:
Statistics Fantasy Football Project
High School and Middle School Statistics Class Project. Fantasy Football is played by an estimated 25 to 30 million people each year and in this project our students will be part of the action! Don't worry, if you don't know one thing about football you will do fine with this project! Each student will become an owner and draft their own players for different positions. Each owner must draft on quarterback, one running back, two wide receivers, and one tight end and keep track of their stats
Subjects:
Grades:
7th - 12th, Higher Education
Types:
CCSS:
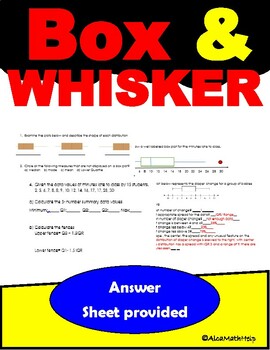
Statistics Quantitative Data Boxplots- 5 Number Summary Data CP, AP Stats
If you are looking for an activity sheet that will engage students as they aim to practice and apply taught concept this box plot activity is the one. It is excellent if you want to check students understanding while having fun. This activity helps students to describe the shape of quantitative distribution, identify centers and spreads by analyzing quartiles (measure of center and variability) . Use the SOCS method to describe the shape, center, spread and outlier as well as other unusual feat
Subjects:
Grades:
7th - 12th, Higher Education, Adult Education
Types:
CCSS:

6 Editable Bar Graph Templates 2.0
Finally a simple and professional graph space that students can fill out without any design issues getting in the way. This file contains 6 ready-to-use graph options. Print them and have students fill them with pencil and ruler, or distribute them over computer and let them practice entering the data. Get a project perfect finish every time. Maybe you just want to fill it out live on a projector? The possibilities are endless! It's okay to say you love these bar graphs. So do we.Contains:- 2 bl
Graphing in Science: A Google Slides Lesson PLUS Guided Notes Handout!
This EDITABLE Google slides (powerpoint) presentation AND guided notes handout covers all of the essential information students need to create and analyze graphs in science. This lesson is designed to refresh students on the concepts of creating graphs using scientific data, analyzing relationships between independent and dependent variables, and includes lots of examples and practice opportunities! This lesson can be used to introduce the important concepts of graphing in science, or it can be
Subjects:
Grades:
5th - 12th, Higher Education, Adult Education
CCSS:
Also included in: Introduction to Science: Unit Bundle! No Prep Required!
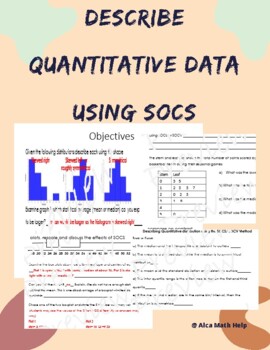
Describe Quantitative Data using SOCS/SOCV- Box plot, Histogram, Stem plot
If you are looking for a worksheet that can be used as a quiz, test, review packet you are at the right place. This activity sheet is suitable for students doing AP Stats and CP Probability and Statistics. This activity sheet allows students to:Use prior knowledge to answer true false questions and fill in the blanks with vocabulary provided.Describe box plots, histogram and stem plot using SOCS.Interpret the shape, center, outlier or any unusual feature along with the spread.
Subjects:
Grades:
11th - 12th, Higher Education, Adult Education, Staff
CCSS:
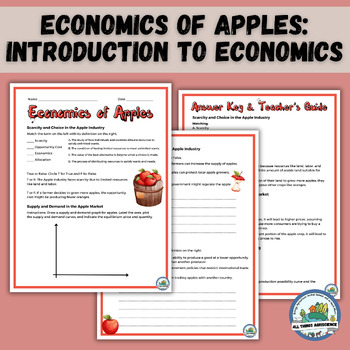
Economics of Apples - Introduction to Economics Worksheets & Activities
Welcome the autumn season with these meticulously crafted economics worksheets and economics activities centered around the fascinating world of apples! Designed for high school economics students, these worksheets are a perfect blend of fun and learning, incorporating activities like matching, drawing, true or false, and short answer questions. Explore Key Economic Concepts with a Seasonal Twist: Immerse your students in the economics of the Apple industry, seamlessly integrating foundational
Subjects:
Grades:
10th - 12th, Higher Education
Types:
CCSS:
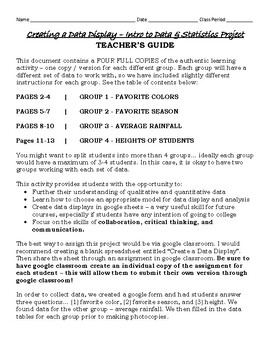
Creating a Data Display
This project provides students with step-by-step instructions to create a data display in google classroom. Four basic types of graphs are discussed:Bar graphHistogramPie ChartLine GraphThis activity also gives students the opportunity to differentiate between quantitative and qualitative data (although this question could be omitted for younger students.This assignment is a great chance for students to use google sheets in a relevant manner. The skills that students will develop from this activ
Subjects:
Grades:
6th - 12th, Higher Education
Types:
CCSS:
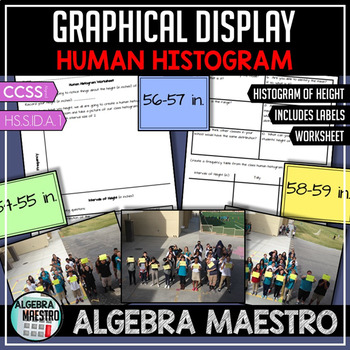
Human Histogram Activity & Worksheet
Human Histogram Activity & Worksheet is designed so that students can experience and model real life statistics. Students will create a histogram and analyze trends and statistical measure on an attached worksheet. My students love this activity because it gets the class up, moving, and we can go outside. The worksheet includes questions on measure of center (central tendencies), spread, distribution, and converting to a other data displays (frequency table).Please you review if you downl
Subjects:
Grades:
6th - 12th, Higher Education, Adult Education, Staff
Types:
CCSS:

Data Analysis and Statistics Daily Quizzes (Algebra 2 - Unit 13)
This file is a collection of content quizzes for use in the unit on DATA ANALYSIS & STATISTICS to challenge your ALGEBRA 2 students. There are two different forms for each concept. All keys are included.Topics Include:✎ Measures of Central Tendency✎ Analyzing Data✎ Working With Samples✎ Binomial Distributions✎ Normal Distributions✎ Confidence Intervals & Hypothesis TestingTeaching Suggestions and Differentiation:★ Use different forms as a partner or group exercise. Students have si
Subjects:
Grades:
8th - 11th, Higher Education
Types:
CCSS:
Also included in: Algebra 2 Daily Quizzes

Introduction To Investing for High School
This lesson is designed to provide high school students with a comprehensive introduction to the world of investing. Students will learn about different types of investments, such as stocks, bonds, and mutual funds, and how to evaluate the risks and potential returns associated with each. I want students to have a better understanding of how to set and achieve financial goals, and how to start planning for their financial future through different investment options.
Subjects:
Grades:
9th - 12th, Higher Education, Adult Education
Types:
CCSS:
NGSS:
HS-ESS3-1
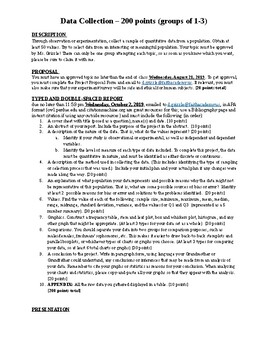
Bluman Statistics Chapters 1-3 Cumulative Project
This is a Microsoft Word document, so it can be edited to fit your own classroom needs. It is a project I used in my 12th grade Statistics class. I gave it out the second week of the quarter and set aside one day a week to work with my students on this project through all of first quarter. This project is aligned with chapters 1-3 of Elementary Statistics: A Step by Step Approach 8th edition, but can be adapted to fit any Statistics textbook. Specifically, this project includes descriptive and i
Subjects:
Grades:
11th - 12th, Higher Education
Types:
CCSS:
Distribution SOCS (Graphic Organizer)
When comparing and describing our boxplots, stemplots, histograms, dotplots, and other data displays it is vital that our students fully explain the differences and similarities in each distribution. SOCS (shaper, outlier, center, and spread) is a great acronym used to remember the four most important concepts that need to be discussed.This graphic organizer is a great tool to use as a warm-up or opener to a quiz or test. Or as an exit ticket to close our a lesson on comparing distributions.Al
Subjects:
Grades:
7th - 12th, Higher Education
CCSS:
Showing 1-24 of 32 results

