TPT
Total:
$0.00

Reading & Interpreting Graphs | Numbers to 10 | Special Education

Rated 4.93 out of 5, based on 15 reviews
4.9 (15 ratings)
;
Passionate Learners LLC
261 Followers
Grade Levels
PreK - 1st, Homeschool
Standards
Formats Included
  • PDF
Pages
202 pages
$5.00
$5.00
Share this resource
Report this resource to TPT
Passionate Learners LLC
261 Followers

What educators are saying

My students with Autism learn best with simple, concrete worksheets that have pictures. This packet of reading graphs was engaging and my students did a great job with it. Thank you for this lengthy and useful resource. And a great price, too!
This resource was helpful to add with our math curriculum. My students enjoyed the variety of graphs.

Description

Engaging Graphs to Keep Students Interest While Learning to Interpret Data.

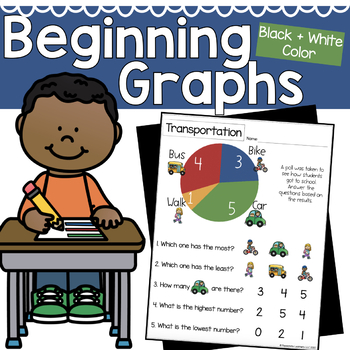
Picture Graphs, Bar Graphs, and Pie Graphs!

Have students master reading graphs by working in small groups, individually, or as a whole class with differentiated graphs that allow for multiple learning levels.

Included:
45 Graphs with Numbers 0-5 : 5 Picture Graphs, 5 Bar Graphs, and 5 Pie Graphs at 3 different levels.
45 Graphs with Numbers 1-10: 5 Picture Graphs, 5 Bar Graphs, and 5 Pie Graphs at 3 different levels.

Black + White and Color Version available for all 90 Graphs

Level 1: Circle the Picture
Level 2: Circle the Word
Level 3: Write the Answer

Related Products

Number Books 1-20 for Google Slides™ | Digital Activity for Special Education

Counting 1-20 No Prep Worksheets


Don't Forget to Leave a Review to Earn TPT Credits!

Follow Passionate Learners on TPT

Total Pages
202 pages
Answer Key
N/A
Teaching Duration
N/A
Last updated Jul 7th, 2020
Report this resource to TPT
Reported resources will be reviewed by our team. Report this resource to let us know if this resource violates TPT’s content guidelines.

Standards

to see state-specific standards (only available in the US).
Organize, represent, and interpret data with up to three categories; ask and answer questions about the total number of data points, how many in each category, and how many more or less are in one category than in another.
Solve addition and subtraction word problems, and add and subtract within 10, e.g., by using objects or drawings to represent the problem.

Reviews

Questions & Answers