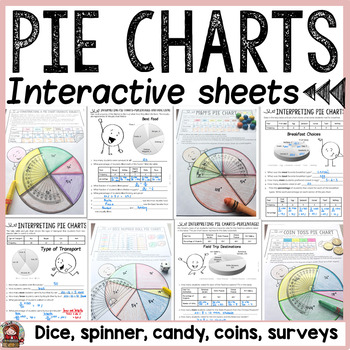
PIE CHARTS/PIE GRAPHS/CIRCLE GRAPHS: NO PREP INTERACTIVE SHEETS
- Zip
What educators are saying
Also included in
- If you would like to teach a unit on pie charts using a combination of task cards and print-n- go activity sheets, then this activity pack fits the purpose. Please note that content in both worksheets and task cards is the same. You may have students work on the task cards at a center and then sendPrice $7.00Original Price $13.50Save $6.50
- Are you looking for a comprehensive Math Curriculum bundle that includes a variety of resources and activities that cover 4th Grade, 5th Grade, and 6th Level standards?This Math Curriculum Bundle has a range of print and digital resources to teach and reinforce key math concepts aligned to the stanPrice $58.50Original Price $116.10Save $57.60
- The graphing bundle features interactive activities for creating and interpreting bar graphs, pictographs, line graphs, line plots and pie charts. Your entire graphing unit for a year!Separate folders featuring both British English and US spellings and terminology included.Great quality and value foPrice $25.00Original Price $34.60Save $9.60
Description
⭐ Separate folders featuring both British English and American spellings and terminology included.
***********************************************************************
This pack of no-prep printables on Pie Charts features hands-on interactive activities to collate, record, construct and interpret data in pie charts. Work in this unit is divided into two sections:
►►I. Reading and Interpreting Pie Charts:
Data sets are represented in fractions and percentages. Students interpret data represented in tally tables and pie charts. Each graphing activity includes target questions that interpret data and is accompanied with a completed sample. There are seven pie charts under this section.
✅ Favorite/Favourite Outdoor Activity
✅ Breakfast Choices
✅ Type of Transport
✅ Field Trip Destinations
✅ Pocket Money Spent
✅ Household Expenses
✅ Best Food
►► II. Constructing Pie Charts:
Activities in this section require students to represent data from tally tables, class surveys and hands-on materials like dice, spinners, M&M’s and coins in pie charts. Step-by-step instruction facilitates the construction of the proportion of each sector that make up a pie chart using a protractor. There are nine pie charts under this section.
✅ Favorite/Favourite Subject
✅ Favorite/Favourite Ice-cream
✅ Favorite/Favourite Color/Colour
✅ Favorite/Favourite Season
✅ Favorite/Favourite Movie
✅ Roll-a-Dice Pie Chart
✅ Spin a Color/Colour Pie Chart
✅ M&M’s Pie Chart
✅ Coins Toss Pie Chart
⭐ This pack also includes 12 cards that feature key mathematical vocabulary, choice of 3 cover templates if collating all sheets into a booklet and 1 poster.
⭐ Suggested Use:
✅ As a follow-up to an instructed lesson on pie charts.
✅ As a practice and assessment activity.
✅ At Independent Math Centers or Work Stations
✅ Morning Work
✅ Early finishers
✅ Homework folder
*********************************************************************
* Similar content on Pie Charts is also available in TASK CARDS format:
PIE CHARTS 54 COLOR TASK CARDS
PIE CHARTS 54 BLACK AND WHITE TASK CARDS
**********************************************************************
* This pack is part of 'Graphs The Mega Bundle' and 'The Pie Charts Bundle'
************************************************************************
⭐⭐ Included completed samples for all graphing activities may be displayed on the interactive whiteboard for students to self-check or to provide a briefing on the requirements of the activity prior to attempting.
Thanks for stopping by!
**********************************************************************
►►Related Products
⚫ CHANCE AND PROBABILITY BUNDLE: EDITABLE SLIDES:TASK CARDS:PRINT-N-GO SHEETS
⚫ BUDGETING FINANCIAL PLANNING AND GRAPHING: FINANCIAL LITERACY(EDITABLE)
⚫ FACTORS: MULTIPLES: PRIME AND COMPOSITE: PRIME FACTORIZATION: GCF: LCM BUNDLE
⚫ 100 TASK CARDS: FACTORS: MULTIPLES: PRIME: COMPOSITE: GCF: LCM
⚫ 32 TASK CARDS: FACTORS: MULTIPLES: PRIME: COMPOSITE: PRIME FACTORIZATION: GCF
⚫ FRACTIONS: INTERACTIVE NOTEBOOK COMMON CORE ALIGNED
⚫ ALGEBRA: DIRECTED NUMBERS (INTEGERS): ADDITION AND SUBTRACTION BUNDLE
⚫ MEAN, MEDIAN, MODE, RANGE, OUTLIER: DATA FOR STATISTICS
⚫ MULTIPLICATION: TIMES TABLES: WHEELS CENTERS ACTIVITY
⚫ INEQUALITIES AND INEQUATIONS
⚫ PLACE VALUE {NUMBER & OPERATIONS IN BASE TEN NO PREP} BACK TO SCHOOL


