Movie Mogul - Mean, Median & Variation - Project - Distance Learning Compatible
- Zip
- Google Apps™

What educators are saying
Also included in
- The project is the core of what I have built my classroom around. Scaffolding learners to real world projects. This bundle includes the 105+ math projects I have written. This is over 2,700 pages of content.21st Century Math Projects each scaffold through an authentic context and math skill buildingPrice $395.00Original Price $564.00Save $169.00
- This is a selection of my Measures of Center & Variance resources all in a money saving Essential Bundle! You save significant money and time versus purchasing these separately!Essential Bundles are designed to give you everything you need to rock your unit. Warmups, Notes, Activities, Games, ExPrice $35.00Original Price $98.00Save $63.00
- 12 of my best selling projects/units all in an organized money saving bundle! These engaging, student/teacher approved math projects that provide rigor, relevance, and cross-curricular content altogether. I have each of these projects advertised separately these projects are $70, so this is over 30%Price $45.00Original Price $70.00Save $25.00
Description
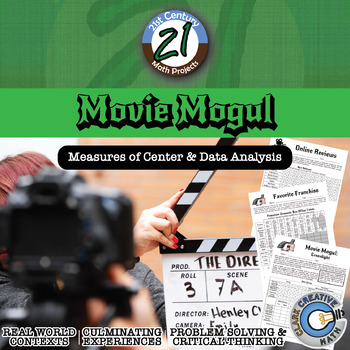
Nowadays online reviews have a huge impact on business. Customer ratings help people decide what to buy and what products to avoid. Movies and entertainment are moving toward the world of intense data analysis of audience views to make business decisions. Companies like Amazon and Netflix have poured resources into developing original content. Let your students sit in the driver's seat! -- and practice Mean, Median and Variation in this 21st Century Math Project!
In this 22 page document you will be given a mapping to the Content Standards, an outline for how to implement the project, and handout resources for students to use. ***THIS PRODUCT HAS BEEN UPDATED WITH A GOOGLE SLIDES INTERACTIVE VERSION INCLUDED. REDOWNLOAD IF YOU HAVE IT ALREADY***
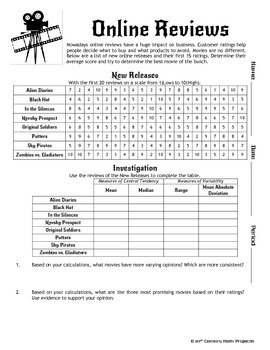
In “Online Review” students will practice calculating the Mean, Median, Range and Mean Absolute Deviation of fictional online reviews.
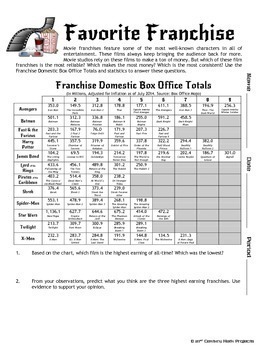
In “Favorite Franchise” students will practice calculating the Mean, Median, Range and Mean Absolute Deviation of the overall domestic gross (adjusted for inflation) of Popular Movie Franchises. They will use this data to order the films, create bar graphs and box and whisker plots.
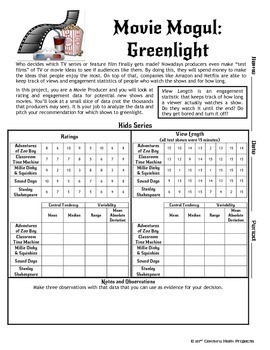
In "Movie Mogul: Greenlight” students will use rating and engagement data of potential TV show or movies to make a recommendation. Students will calculate the Mean, Median, Range and Mean Absolute Deviation in an effort to find the best films to greenlight.
Download the preview to see pretty much everything!
You may be interested in the following discounted bundles. SAVE $$$!
•Measures of Central Tendency & Data Analysis
•21st Century Math Projects -- All the Projects
Need an Entire Curriculum?
•21st Century Pre-Algebra –- the Entire Curriculum
For more tips, tricks and ideas check out the Clark Creative Education Blog
And join our community where I post ideas, anecdotes, elaborations & every once in a while I pass out TPT gift cards! And jokes! I do jokes too!

