
Modeling Daylight Length with Trig Functions Data Set

The Statistics of the American Dream
5 Followers
Grade Levels
9th - 12th
Subjects
Formats Included
- Google Sheets™
- Excel Spreadsheets
The Statistics of the American Dream
5 Followers

Made for Google Drive™
This resource can be used by students on Google Drive or Google Classroom. To access this resource, you’ll need to allow TPT to add it to your Google Drive. See our FAQ and Privacy Policy for more information.
Also included in
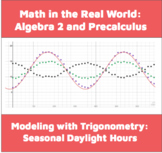 In this activity, students analyze data sets modeling hours of sunlight in three cities over the course of the year (Sydney, Juneau, and Washington D.C.) To complete the activity, students must:-- practice computing the parameters of sinusoidal functions and check their work by fitting an equation tPrice $3.00Original Price $4.00Save $1.00
Description
This is the data set needed to complete the activity Modeling Daylight Length with Trig Functions.
Total Pages
Answer Key
N/A
Teaching Duration
N/A
Report this resource to TPT
Reported resources will be reviewed by our team. Report this resource to let us know if this resource violates TPT’s content guidelines.
Reviews
Questions & Answers
5 Followers
