How We Get To School - Counting, Sorting, & Computer Graphing
- Zip
Description
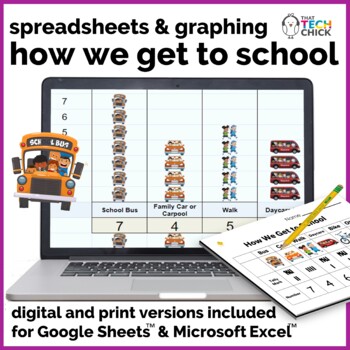
Take your graphing lessons to a whole new level with this high interest, introductory activity on entering data and creating a pictograph using either Google Sheets or Microsoft Excel! It's an excellent way to show your young students the power of technology and how quickly it can transform data into a visual respresentation that they can relate to.
Your students will survey their classmates about how they get to school and enter the data into a preformatted spreadsheet that automatically generates a cute pictograph! You don't have to be a Spreadsheet Whiz to use this in your classroom or computer lab--I've done the work for you! Need an activity for a classroom center? Simply duplicate, cut apart and bag different combinations of transportation cards for students to count and tally on their own.
This Resource Includes:
- "How We Go to School" Preformatted Spreadsheet in both Google Sheets and Microsoft Word. Just enter the data gathered on the different ways students get to school and a Pictograph is automatically generated.
- Tally Sheets to Record Data
- Six Unique Sheets of 12 Transportation Cards so the Activity Can Be Used as a Classroom Center or Individually. Just cut them apart, bag them and distribute.
- Detailed Teaching Suggestions
- Links to Graphing Videos for Young Students.
- Links to Websites with Teaching Suggestions
Your Students Will:
- See how quickly computers can calculate data and produce a graphical representation
- Learn how to survey their peers
- Understand the relationship between the spreadsheet and graph
- Have fun!
Interested in more Spreadsheet and Graphing Activities? Click here!


