
Graph Task Cards for Bar Graphs, Pictographs, and Line Plots


- PDF
What educators are saying
Also included in
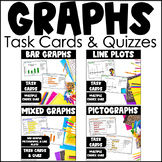 Looking for a set of task cards covering bar graphs, line plots, and pictographs? This graphing bundle includes a total of 96 task cards and four graph quizzes. Your purchase will included four separate sets of task cards with 24 task cards in each set. Each task card has a multiple choice word probPrice $8.00Original Price $10.00Save $2.00
Description
Looking for PRINT and GO task cards AND a quizzes for bar graphs, line plots, and pictographs? Twenty-four task cards are provided covering a mix of vertical bar graphs, horizontal bar graphs, pictographs, and line plots. Each task card has a multiple choice word problem about the graph’s data. Word problems include addition, subtraction, multi-step problems, and questions focused on interpreting graph data. Some line plots focus on measurement data to the nearest inch including fourths, halves, and three-fourths.
A 20 question quiz aligned to the task cards is included. Keys for the task cards and quiz are included for quick assessing.
Your Purchase Will Include:
- Directions
- 24 task cards
- Student answer recording sheet
- Task card answer key
- Quiz over graphs
- Quiz answer keys
Take a peek at the preview for a better picture of what is included!
Note: If you own the Graph Task Card Bundle, please do not purchase this. You already own it. If you are interested in the bundle, click here.
Earn TPT Credits for Your Future Purchases:
- Go to your “My Purchases” page and click “Provide Feedback.”
To Be the First to Know About New Products and Freebies:
- Click the star to follow me!
