6th Statistics & Probability Unit Video Lessons Remote/Flipped/Distance Learning
- PDF
- Internet Activities
What educators are saying
Also included in
- Are you interested in Flipped Learning? Or are your students stuck at home learning? Do you have sick students or students that are on vacation? Are you or your students quarantined? Flipped Learning and video lessons are one solution!100 TOTAL INSTRUCTIONAL VIDEOS INCLUDED!!14 Videos - Arithmetic OPrice $80.80Original Price $101.00Save $20.20
Description
Are you interested in Flipped Learning? Or are your students stuck at home learning? Do you have sick students or students that are on vacation? Are you quarantined because of the Coronavirus? Flipped Learning and video lessons are one solution!
Included in this resource:
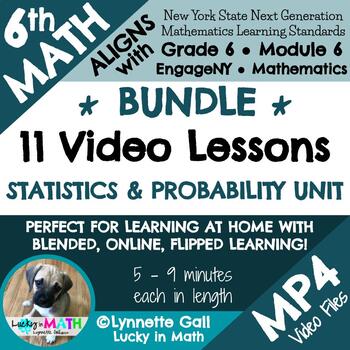
ELEVEN video lessons BUNDLE
Videos are shared through a PDF file that includes links to MP4 Files in Google Drive. Videos can be downloaded as MP4 files.
Video Lesson Topics:
Video 1 (6.SP.1 & 6.SP.2 - Intro to Statistics & Statistical Questions)
Video 2 (6.SP.4 - Dot Plots & Frequency Tables)
Video 3 (6.SP.4 - Histograms & Frequency Tables)
Video 4 (6.SP.2 - Shapes of Distributions)
Video 5 (6.SP. 2 6.SP.3 6.SP.5 - Mean Median Mode)
Video 6 (6.SP.5 - Mean Absolute Deviation - MAD)
Video 7 (6.SP.5 - Range & Interquartile Range - IQR)
Video 8 (6.SP.4 - Box & Whisker Plots)
Video 9 (6.SP.6 & 6.SP.7- Intro to Probability)
Video 10 (6.SP.6 & 6.SP.7- Probability Likelihood)
Video 11 (6.SP.7 & 6.SP.8 - Experimental Probability)
These 11 MP4 files make up my Statistics and Probability unit. This resource aligns with the Eureka Math / Engage NY curriculum of the New York State Sixth Grade Math Module 6 and NYS standards. Teachers can use this as a stand alone resource or in conjunction with the New York State Module. This unit focuses on statistical questions, data, dot plots, frequency tables, histographs, mean, median, mode, range, interquartiles range, quartiles, box and whisker plots, probability, experiments, and much more! You can watch this directly in Google Drive with the Screencastify extension or download the MP4 and watch through Quicktime or another video viewing software. For students, you can easily attach to Google Classroom!
These work well as homework for students so they come in with prior knowledge on the topic too. Or you can send home to parents so they understand how their child is learning in the classroom!
My lesson videos follow along perfectly with my guided notes sheets! They also work great with my practice sheets, exit tickets, and warm up sheets also available in my TpT store! There are free previews for those too!
PLEASE NOTE:
I used this item in my own 6th grade math classroom! If you have any questions, please feel free to reach out to me on TpT or via email at luckyinmath@gmail.com :)
A little bit about Flipped Learning from Lucky in Math:
In my sixth grade math classroom, I use an approach to teaching called the flipped classroom. The basic concept behind a flipped classroom is that what was traditionally done in the classroom (lecture/direct instruction) becomes homework and what was traditionally done at home (paper homework) is done in the classroom. The direct instruction or lecture portion of the class is the homework. When students come to class each day, I assess their learning from their videos with a warm up (traditional exit ticket). The rest of my class time is used for practicing the concepts from the video (homework in the traditional setting), working with manipulatives, playing math games, working with each other, and doing activities intended to enrich the curriculum. This is my third year of implementation! Feel free to reach out with any questions or concerns on the flipped classroom!


