
2.MD.10 Graphing Unit, Bar Graphs and Picture Graphs 2.MD.D.10 - 2nd Grade Math


- PDF
What educators are saying
Also included in
 This is a 2nd grade math bundle that contains all 10 standards within the Measurement and Data 2nd grade Common Core domain. Within this domain, there are full lesson plan units that cover measurement, telling time, counting money, and graphing. Every single unit within this bundle comes with lessonPrice $40.00Original Price $53.00Save $13.00
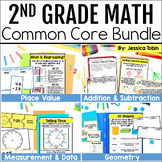 Are you looking for 2nd grade math activities that are standards-based? Are you looking for lesson plans, worksheets, and differentiated math group centers activities? This is a Common Core aligned math unit bundle with all you need! This 2nd grade math bundle covers all four math domains. Each domaPrice $98.00Original Price $147.25Save $49.25
Description
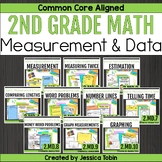
This 2nd grade math standards-based Graphing unit focuses on the Common Core math standards 2.MD.10. This asks students to create and draw picture graphs and bar graphs, plus ask and answer questions about them. There are daily lesson plans, whole group activities, partner practice activities, MATH group centers, exit slips, and assessments.
What's included in the 4 daily lesson plans:
- Whole group activity
- Partner practice activity
- MATH group: Math writing, Apply new skills, Teacher time, Hands-on math (Teacher time is differentiated learning opportunities for remediation, on-level, and enrichment.)
- Exit slip
2.MD.10 Focus:
- Day 1- Reading Bar Graphs and Picture Graphs
- Day 2- Drawing Bar Graphs
- Day 3- Drawing Picture Graphs
- Day 4- Mixed Review
CCSS.Math.Content.2.MD.D.10
Draw a picture graph and a bar graph (with single-unit scale) to represent a data set with up to four categories. Solve simple put-together, take-apart, and compare problems1 using information presented in a bar graph.
This math unit is part of a 2nd grade MD bundle.
- Click HERE for the bundle.
- This unit is also part of a full-year Common Core Standards based bundle that you can find HERE.
Want more CCSS math units?
Like this resource? Make sure to follow my store to keep up with brand-new products!
This purchase is for one single classroom only.
If you're interested in sharing with other classrooms, make sure to buy the extra licenses for a discount through the TeachersPayTeachers tool. If you are interested in a site license, please contact me for a quote at jessica.L.tobin@gmail.com.
