TPT
Total:
$0.00
Selected
Grades
Subjects

Subjects

Arts & Music
English Language Arts
Foreign Language
Holidays/Seasonal
Math
Science
Social Studies - History
Specialty
For All Subject Areas
176 results

7th grade math handout interactive whiteboards
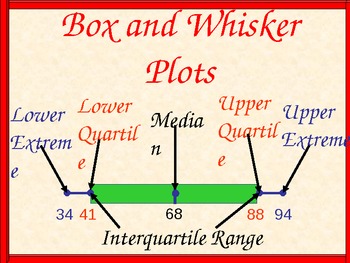
Preview of Box and Whisker Plots and Handout, Math PowerPoint
Box and Whisker Plots and Handout, Math PowerPoint

A unique 11 page lesson on Box and Whiskers Plots. The lesson begins with 2 real life situations on the heights of roller coasters.The second roller coaster will have an outlier to illustrate the effect on the box and whisker plot. Two additional slides will have runs scored by your favorite team and one to assign for homework. Worksheets for the student will follow the first 7 slides. Print using 2 PowerPoint slides back to back. This worksheet will keep students on task during the presentati
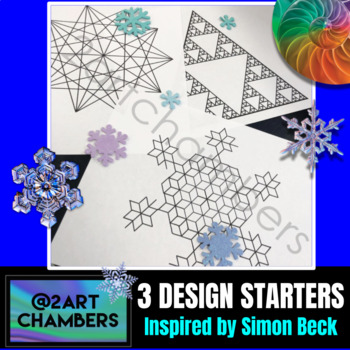
Preview of GEOMETRIC DESIGN STARTER PAGES! Inpsired by Simon Beck Snow Art
GEOMETRIC DESIGN STARTER PAGES! Inpsired by Simon Beck Snow Art

Created by
2ARTChambers
GEOMETRIC DESIGN STARTER PAGES!This set is a 6 page PDF with 3 blanks for mindful coloring and 3 full color samples.These were created as an extension to a lesson about artists inspired by nature!We studied the INCREDIBLE snow art of Simon Beck who creates amazing, unique designs with his feet in snow! After watching several interviews and comparing his work to Optical illusions, Kaleidoscopes and String Art, students chose a design, similar to his creations, to color in! Connections to math, s
Preview of Editable Venn Diagram

Editable Venn Diagram

Created by
Alisa's Loot
Who doesn't use Venn Diagrams? These were created to be editable. They can be used on an interactive board, computer, or printed out. There are 10 different Venn Diagrams included. Thanks and Enjoy!
Preview of Percent of Increase/Decrease and Handout, Math PowerPoint
Percent of Increase/Decrease and Handout, Math PowerPoint

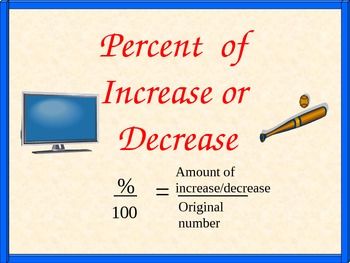
A unique 34 page lesson on the Percent of Increase/Decrease. The lesson begins with 2 real life situations of percent of increase then decrease. Following, are 6 visual slides for the student to determine the percent of change. Next, will be 5 challenging slides for students to create examples of change. Print using 6 PowerPoint slides back to back. This worksheet will keep students on task during the presentation. Works great! I have used this teaching method for over 10 years. Created by Davi
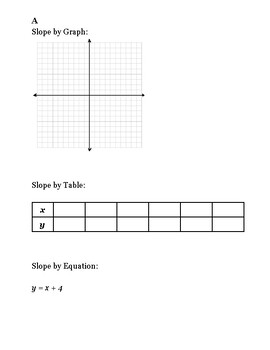
Preview of Linear Relationship among Graphs, Equations, & Tables
Linear Relationship among Graphs, Equations, & Tables

Created by
Mistah Seaver
Twenty-seven practice problems that can be projected onto a white-board for instruction or student practice of the relationship among graphs, linear equations, and tables. Sheets could also be printed to act as individual or group investigation of the concept(s).
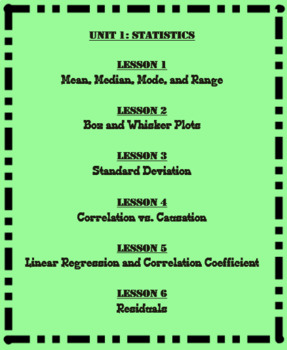
Preview of Unit 1-Statistics (Math 1)

Unit 1-Statistics (Math 1)

This is the first Unit of the eight Units that I cover in Math 1. This unit is broken up in to six different lessons that are listed below. Each lesson includes a SMART Notebook presentation, a student note-taking guide, and an answer key. Also included in this unit are student flashcards, a test outline, and a 25 question multiple choice test. Unit 1: Statistics Lesson 1: Mean Median Mode Range Outliers and Skew Lesson 2: Box and Whisker Plots Lesson 3: Standard Deviation Lesson 4: Correlati
Preview of Integer Review with All 4 Operations PowerPoint and Handouts
Integer Review with All 4 Operations PowerPoint and Handouts

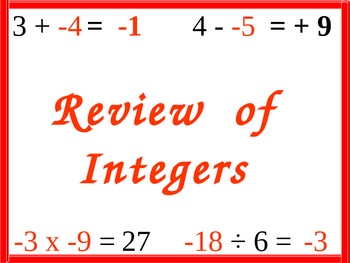
This lesson is for either the introduction or review of all operations with integers. Number lines, two color counters, number patterns and tables have been used to support the rules of integers. Following the example problems, there will be several problems for the students to complete for review. The last three slides will contain a summary of the rules. PowerPoint handouts are part of this lesson. Provided will be a 4 page handout on each of the four operations. Many Number Sense Content St
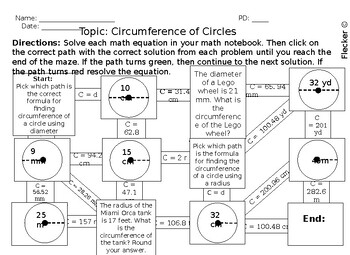
Preview of Circumference Quest (Digital + Hardcopy Maze)
Circumference Quest (Digital + Hardcopy Maze)

Created by
Andrew Flecker
Embark on an exciting journey through the "Circumference Quest" – a digital maze designed to enhance students' understanding of calculating the circumference of a circle. This engaging educational experience combines the thrill of exploration with the challenge of mastering mathematical concepts.Overview: The Circumference Quest is a digital maze that immerses students in a captivating world filled with circular challenges. As they navigate through the maze, students encounter various scenarios
Preview of Common Core Standards Geometry, Number Sense, Coordinate Planes Handout
Common Core Standards Geometry, Number Sense, Coordinate Planes Handout

This PowerPoint lesson is very comprehensive and student involvement is significant. The following areas will be covered: understanding the coordinate plane, plotting points, reflection, dilation, integers, absolute value, rational numbers, perimeter, and area. Handouts with answers will support each part of this lesson. Common Core State Standards are: Geometry 5.G 1 & 2, 6.NS 5-8, and 7.NS 1
Preview of Linear Regression and the Correlation Coefficient (Math 1)
Linear Regression and the Correlation Coefficient (Math 1)

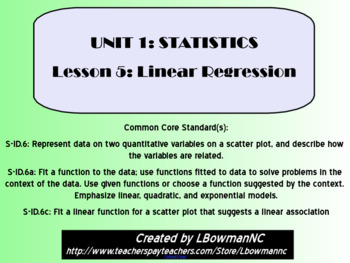
This lesson is the fifth of six lessons in the Math 1 Statistics Unit. This lesson includes important vocabulary, examples (guided practice), and class work (independent practice). At the end of the presentation is a Ticket Out the Door that can be used as a formative assessment. There is a note-taking guide for the students to fill out as the teacher goes through a SMART Notebook presentation. Unit 1: Statistics Lesson 1: Mean Median Mode Range Outliers and Skew Lesson 2: Box and Whisker
Preview of Integers Guided Notes Big Ideas Red Accel: 7th Grade Chapter 1
Integers Guided Notes Big Ideas Red Accel: 7th Grade Chapter 1

Created by
Dianna Gallagher
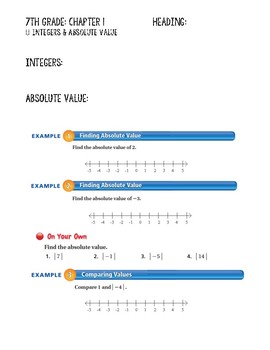
Guided/Scaffolded Notes: A template for students to use to take class notes based on the exercises in the Big Ideas Math Red 7th Grade curriculum. I use the .pdf on my projector and fill in the notes while students fill in their packets. If you'd like the Word file so that you can edit it, send me a private message after purchasing. I do have additional notes packets for all 6th and 7th grade Big Ideas chapters. If you don't see what you are looking for, please send me a message.
Preview of proportion word problems powerpoint

proportion word problems powerpoint

Created by
The Math Stone
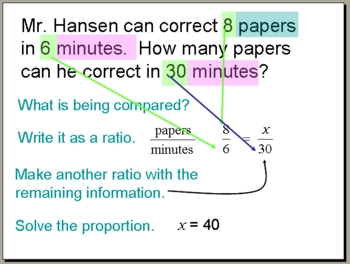
proportion word problems powerpoint 6th grade CA math standard: NS 1.3
Preview of Evaluating Expressions Through PEMDAS
Evaluating Expressions Through PEMDAS

Created by
Amber Hendershot
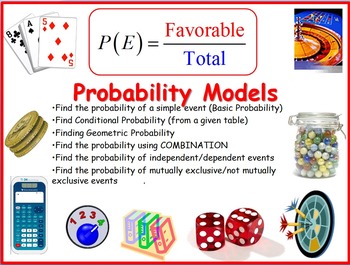
In this lesson, students dive into the order of operations, utilizing PEMDAS to grasp the evaluation of expressions involving multiple operations. Through the aid of a graphic organizer, students independently practice problem-solving, strengthening their understanding of this fundamental math concept.
Preview of Probability Models

Probability Models

This handout drills the understanding of the different models of probability. Student would have to first determine under which model should this problem fit, then, apply the appropriate strategy to answer the questions. There are many ways to answer each of the questions provided in this handout. I provided "An" answer key. In this handout, you will find a set of 40 questions on the following probability models: 1. Detailed visual description of the Standard Deck of Cards 2. Basic Probab
Preview of Superman Multiply and Divide Know the Place Lesson

Superman Multiply and Divide Know the Place Lesson

Students can enjoy a fun lesson identifying the names of each digit in a multiplication and division assignment. They will also have an activity to decorate a symbol and make a T-shirt. Teachers can use this activity book of activities to support students to practice understanding the concept of multiplication and division relationships.
Preview of Holiday Fun. Working with Percents solved with Proportions and Mental Shortcuts
Holiday Fun. Working with Percents solved with Proportions and Mental Shortcuts

Here is a fun PowerPoint activity with a holiday theme to use in December. In this lesson, students will be shopping for gifts, calculating sales commission, and determining the amount of weight lost by Santa! The lesson involves solving percentage problems with proportions. Next, you will be solving the same problem using mental math. Handouts coincide with the presentation which enables the students to work along to complete the proportions and apply mental math skills. Two full page handout
Preview of Correlation vs Causation (Math 1)

Correlation vs Causation (Math 1)

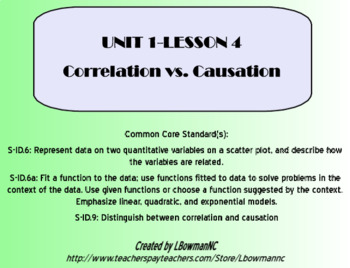
This lesson is the fourth of six lessons in the Math 1 Statistics Unit. This lesson includes important vocabulary, examples (guided practice), and class work (independent practice). At the end of the presentation is a Ticket Out the Door for the students. There is a note-taking guide for the students to fill out as the teacher goes through a SMART Notebook presentation. Unit 1: Statistics Lesson 1: Mean Median Mode Range Outliers and Skew Lesson 2: Box and Whisker Plots Lesson 3: Standard
Preview of Statistics Activity

Statistics Activity

Created by
MathMajorLady
This powerful activity focuses on using the TI 84+ calculator to calculate the mean, median, range, z-score, standard deviation, mean absolute deviation, permutations, combinations, and probabilities with normal distribution. You will also gain insight on how to create multiple box and whisker plots on one graph. This is aligned to the Common Core and VA SOLs A.9, A.10, AII.11, and AII.12.
Preview of Mean Median Mode Range Outliers and Skew (Math 1)
Mean Median Mode Range Outliers and Skew (Math 1)

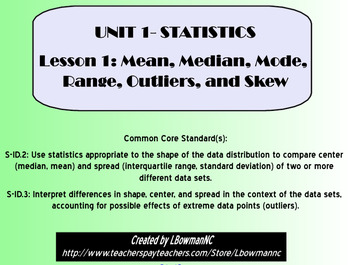
This lesson is the first of six lessons in the Math 1 Statistics Unit. This lesson includes important vocabulary, examples (guided practice), and class work (independent practice). The examples and class work are broken up in to two separate "chunks". This allows the students to establish a foundation for the topics covered before moving on to more challenging problems. At the end of the presentation is a Ticket Out the Door that can be used as a formative assessment. There is a note-taking g
Preview of Variables, Expressions, Equations and Handouts.
Variables, Expressions, Equations and Handouts.

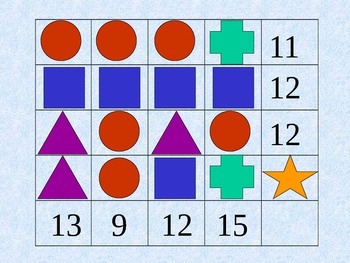
This lesson is a fun and visual way to learn about variables, expressions, and equations. Students will create and then solve several equations based on illustrations in a puzzle. Following, they will substitute the value into the puzzle to see if their solutions are correct. The puzzle displayed above will be printed as a full page. Also, there are 6 slides pertaining to solving this puzzle, printed as a single page. These handouts will keep your students participation at a peak! Th
Preview of Unit 4: Geometry (Math 1)

Unit 4: Geometry (Math 1)

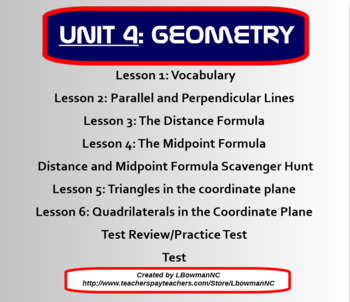
This is the fourth of seven Units that I cover in Math 1. This unit is broken up in to six different lessons that are listed below. Each lesson includes a SMART Notebook presentation with a formative assessment at the end, a student note-taking guide with class work, and an answer key. Also included in this unit is a midpoint and distance formula scavenger hunt, a test review, and a 30 question multiple choice and free response test. BONUS!!! Included in this download are printable "I CAN" Sta
Preview of Word Problems in Slope-Intercept Form (Math 1)
Word Problems in Slope-Intercept Form (Math 1)

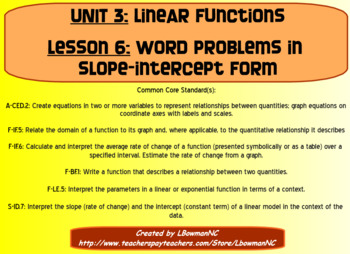
This lesson is the sixth of nine lessons in the Math 1 Linear Functions Unit. In this lesson, the students will learn how to: ~write linear equations in function notation that describes the relationship between two quantities, ~evaluate functions for an indicated value, ~solve real world problems using a linear equation, ~interpret the slope and y-intercept of linear functions in terms of their context. The download for this lesson includes guided notes (with examples and class work probl
Preview of Standard Deviation (Math 1)

Standard Deviation (Math 1)

This lesson is the third of six lessons in the Math 1 Statistics Unit. This lesson includes important vocabulary, examples (guided practice), and class work (independent practice). The examples and class work are broken up in to two separate "chunks". The first chunk requires the students to calculate the standard deviation by hand. The second chunk requires the students to find the standard deviation using a graphing calculator and then to use standard deviation to compare different sets of d
Preview of proportions & similar figures powerpoint

proportions & similar figures powerpoint

Created by
The Math Stone
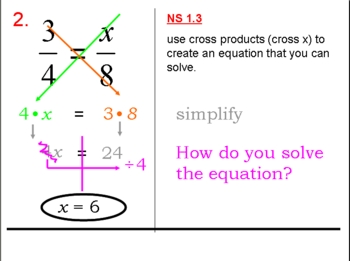
Proportions powerpoint lesson: - cross products method - similar figures 6th grade CA math standard: NS 1.3
Showing 1-24 of 176 results

Find Math resources | TPT

Importance of learning math skills

It's no secret that mathematics is one of the foundational subjects that students need to learn. Math forms the basis for so many other subjects — like science, engineering, and technology — and because of that, it's essential that students develop strong math skills starting from a very young age.

Benefits of learning math

Learning math has many benefits. It helps students:

  • Begin to develop problem-solving, logical reasoning, and critical-thinking skills
  • Grow their understanding of numbers and basic operations
  • Understand how math is used in real-life situations

By ensuring that students have a solid foundation, teachers can help set them up for future success.

Discover printable and digital math resources

Math resources are an integral part of effective math education. On TPT, math resources come in various forms: from worksheets and full-year curricula to manipulatives and educational games. They can be used to enhance learning, assess student’s mastery of math concepts, and engage students in meaningful learning. By incorporating math resources from TPT into your teaching toolbox, you can create a rich learning experience that strengthens students’ understanding of math concepts and encourages a positive attitude toward math.

If you’re a teacher or parent looking for printable and digital math worksheets, TPT has an extensive collection of math resources across topics and grade levels. No matter what math topic your students are working on — whether you’re teaching numbers to kindergarteners or algebra to 9th graders — TPT has resources designed to help with any math learning need.

With a little encouragement and plenty of resources, TPT resources can make teaching and learning math so much easier. Plus, you can expand students’ knowledge even further by exploring TPT science resources, which are frequently paired with math lessons.

Frequently asked questions about math resources

What types of math lessons are available on TPT?

There are many different types of math resources sold by Sellers on TPT. Some popular math lessons include geometry, mental math, algebra, fractions, place value, measurement, and decimals.

How do I find math lessons on TPT?

Educators can save time preparing math lessons with resources created by experienced teachers. Simply start a search for math resources on the TPT marketplace, and filter by grade level, price, and/or resource type to find materials that've been proven to work in classrooms like yours. No matter what you’re teaching, there are plenty of math lessons and activities sold by Sellers on TPT that are tailored to meet your students' skill levels.

How do I support students struggling with math?

If your student or child is struggling with a specific math concept, you can provide extra support and resources such as math worksheets. Sometimes, visual aids like charts, graphs, and manipulatives can help children understand abstract concepts better.

How can I make math fun?

Students learn best when they're engaged! Sprinkle a little fun into your math lessons by using educational games, videos, puzzles, and real-life scenarios. If your class seems to find math boring or uninteresting, you can also try connecting lessons to their interests or hobbies. Encourage them to ask questions and explore mathematical concepts in different ways.