51 results
6th grade statistics research
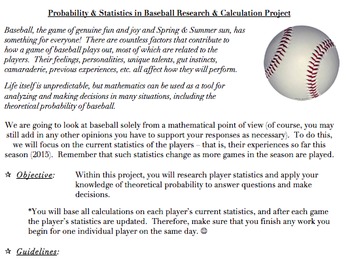
Probability & Statistics in Baseball Project (Common Core Aligned, AND FUN!)
The problems and activities within this document are designed to assist students in achieving the following standards: 6.SP.B.5, 7.SP.C, HSS.CP.A.2, HSS.CP.A.3, HSS.CP.B.7, HSS.CP.B.9, as well as the standards for mathematics practice and the literacy standards. They are also designed to help the teacher assess the students’ abilities when it comes to working with the ideas within the standards.This document contains the following:A project designed to allow students to investigate theoretical
Subjects:
Grades:
5th - 12th, Higher Education, Adult Education, Staff
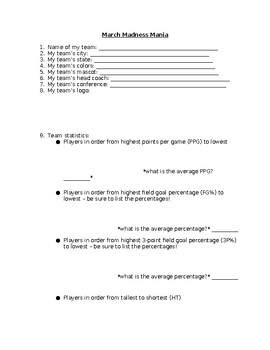
NCAA March Madness Basketball Tournament Team Research Statistics
Do you have students interested in the March Madness basketball tournament? Then this is the activity you need!To begin our March Madness unit, we look at all of the teams participating in the tournament and complete a map together to show where each team is from. We notice that some states have more than others and some states have none, and spend time discussing why that might be. Students will complete their own March Madness bracket.Students will then select a team in the NCAA March Madness
Grades:
4th - 9th
Types:
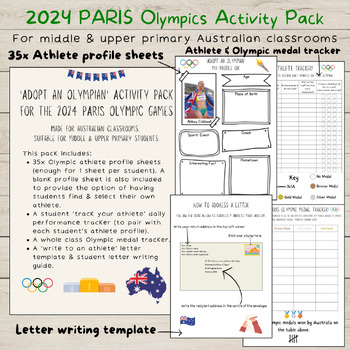
2024 PARIS Olympic Games Activity Pack | Middle & Upper Primary | Australia
Are you an Australian Teacher who is looking for a fun & engaging way to connect your students to the 2024 PARIS Olympic Games? This is the PERFECT resource for you! This activity pack provides students with the opportunity to:Research & profile an Australian Olympic athlete who has been selected to compete at the 2024 Paris Olympic Games.Individually track their athlete over the 19 days of the Olympic Games.Write a personal letter of support to their athlete, to be posted to them at the
Subjects:
Grades:
3rd - 6th
Types:
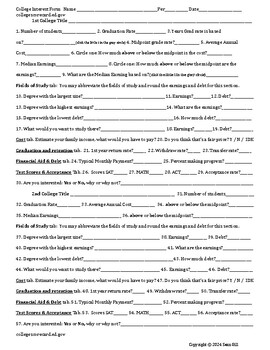
College Research Project Unit
This is an excellent unit on college research. If your school is college focused or you just need a interested based project to get the students engaged, this is a great way to get kids interested in colleges and their stats. Did you know that the federal government compiles all the FAFSA data? It keeps track of how much money each person who filled out a FAFSA makes over the long term (10 years+). There is a wealth of data on every college that has ever accepted federal funding and it is all at
Subjects:
Grades:
6th - 12th
Types:
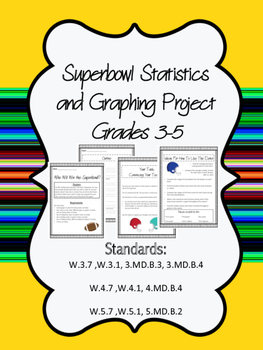
Superbowl Statistics, Graphing Project with Writing Prompt 3-5
****NEWLY UPDATED*****
This project has students selecting a team that will win the Superbowl, then using statistics from the season and graphing to PROVE their team will win. The document lists requirements, types of graphs and ideas for ways to show data with the team's season statistics. Teachers/students will need to go to the NFL website and research the statistics. Teachers could also print these off for teams to use.
The second half of the project has been added in support of CCSS. Stude

GRAY WOLF MATH PROJECT
Wolf. Wolves. Gray Wolf. Wildlife. Percent Applications. Threatened Species.Connect math to environmental science.Vilified by folklore and popular culture, there probably is no mammal in the world as misunderstood as the gray wolf. As a keystone species it is vital to maintaining a healthy ecosystem. It has largely been exterminated in the United States although recent conservation actions have seen a reintroduction of the gray wolf into Yellowstone National Park. Students will study habitat
Subjects:
Grades:
5th - 8th
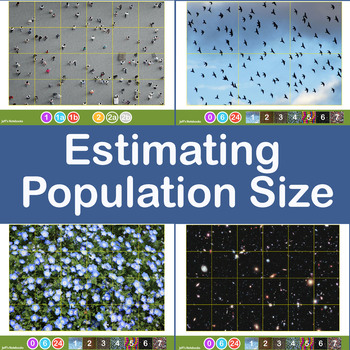
Estimating Crowd and Population Size using Jacob's Method
This investigation delves into estimating the size of a large population of objects by taking a sample and applying some basic mathematics. It encourages sharing of data, refining methods of collection of the data and discussion about the accuracy and limitations of the method used.Jacob's Method of counting large numbers of objects is simple. Draw a grid dividing the area covered into equal size squares. Estimate (by counting) the population of one grid then multiply this by the number of squar
Subjects:
Grades:
6th - 11th, Higher Education, Adult Education
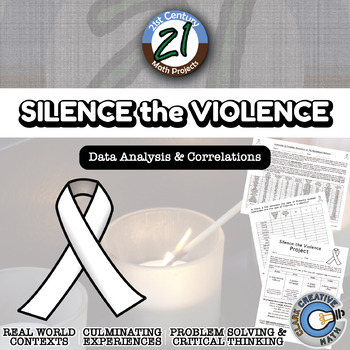
Silence the Violence -- International Data Analysis - 21st Century Math Project
Silence the Violence intends to take a closer look at gun violence throughout the world. Is there a correlation between gun ownership and gun violence? While this is on the news, and people argue back and forth, unfortunately there are not a lot of statistics cited.I built this project through the use of correlations of authentic international data. I have included content for either middle school (plotting and calculating) or high school (calculating correlation with summations). The results ar
Subjects:
Grades:
6th - 12th
Types:
CCSS:
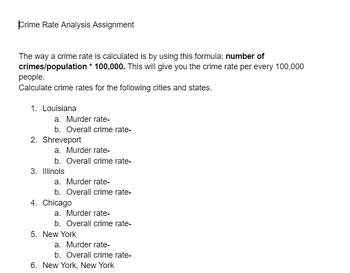
Crime Rate Analysis Assignment
A web based assignment to allow students to calculate the crime rates of various U.S. cities.
Grades:
5th - 12th, Higher Education, Adult Education
Types:
Math- Baseball: A Game of Numbers
In this Exploration, students will examine the statistics of four baseball players. The focus is to understand how the data is calculated. This classic American sport has always used math to keep track of everything that happens in the game. This math Exploration includes detailed, student-friendly Steps to Success that lead the learner through the process of creating a high-level, quality independent project. To add rigor and thoughtfulness, students reflect on their Exploration by answering s
Subjects:
Grades:
3rd - 8th
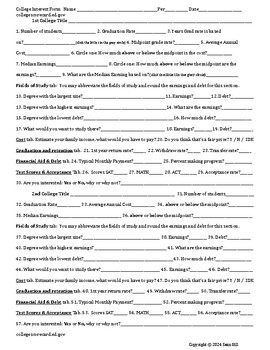
College Interest Form (College Research Unit 1st Lesson)
This is an excellent Introduction to college research. If your school is college focused or you just need a interested based activity to get the students engaged, this is an intriguing assignment that gets kids curious about different colleges and their stats. Did you know that the federal government compiles all the FAFSA data? It keeps track of how much money each person who filled out a FAFSA makes over the long term (10 years+). There is a wealth of data on every college that has ever accept
Subjects:
Grades:
6th - 12th
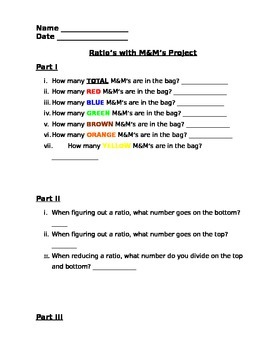
Ratios with M&M's Project
This is a quick assessment to help students figure out the ratios of M&M's in a bag. You provide the candy and I provide the worksheet. Students will be requested to open the bag, count all candies and than follow the directions marking ratios for each listed color.
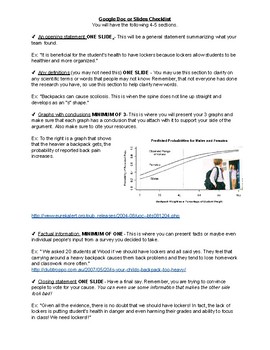
Statistics Debate Project
This is a final projects for students to do to end the statistic unit. It allows them to explore real life graphs and use them to build on their side of the argument. Students learn public speaking skills, powerpoint making skills, research skills, and how to read real like graphs.
Subjects:
Grades:
6th - 8th

GRIZZLY BEAR MATH PROJECT
Grizzly Bear. Percent Applications. Math Project. Wildlife. Threatened Species. Connect math to environmental science. Kids love this project!Build awareness with your students around habitat loss for the majestic grizzly while using estimation and percent to calculate population numbers and habitat loss.Students will love learning about this amazing animal while using statistics in a meaningful way.The data for the grizzly populations for Canada and the United States is current and includes
Subjects:
Grades:
5th - 8th
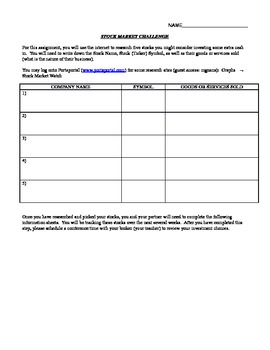
Stock Market Challenge Information Sheet
This document provides students a place to record the information they have gathered from their Stock Market research. It includes a place for students to record their stocks' 52-week high and low, dividends paid, does the company produce goods or provide services, as well as the reasoning as to why your student chose to purchase that particular stock. There are enough recording sheets for 5 stocks. This is a great way to teach students how to record and organize information for later use. If
Subjects:
Grades:
4th - 7th
Types:
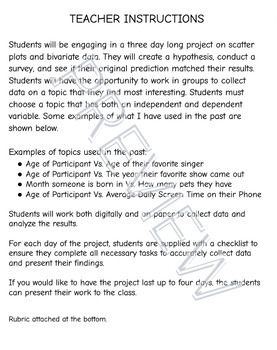
Scatter Plot and Bivariate Data Project
Students will be engaging in a three day long project on scatter plots and bivariate data. They will create a hypothesis, conduct a survey, and see if their original prediction matched their results. Students will have the opportunity to work in groups to collect data on a topic that they find most interesting. Rubric attached at the bottom.
Subjects:
Grades:
6th - 12th
Math- Olympic Math:Using Math to Evaluate Sports Performances
Students will look at the Olympic games through a mathematical lens. Using their mathematical thinking they will use data and research to create graphs and story problems. If you are doing this Exploration during an Olympic year, students can use the data from this year. If there are no Olympics happening this year, choose a historic Olympics to analyze.This math Exploration includes detailed, student-friendly Steps to Success that lead the learner through the process of creating a high-level,
Subjects:
Grades:
3rd - 8th
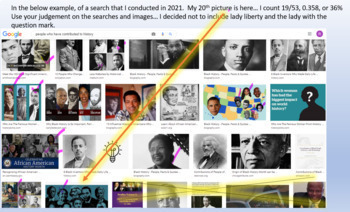
Women's History Month Probability Project
Students learn about suffrage and representatio of women. Students conduct Google searches on favorite subject, sport/hobby, future career and find the probability of a woman appearing in the first 20 images. Students make conjectures about representation of women in those areas. Students identify women they admire and create a video summarizing their findings.Can be adapted to images for African Americans for Black History Month, Hispanic Americans for Hispanic Heritage Month, etc.
Subjects:
Grades:
6th - 12th, Adult Education, Staff
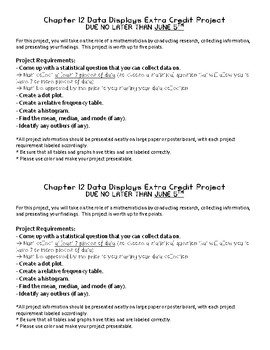
Probability Data Displays Project
This project was used as an extra credit project that ties in with chapter 12 of the 6th grade Go Math program. This project focuses on data displays, including dot plots, frequency tables, and histograms. This allowed students to create a statistical question, collect data, and present their findings. This product includes the directions sheet that I gave to my students, and then the students created posters that displayed the required information. There are two directions sheets per page i
Subjects:
Grades:
4th - 8th
Types:
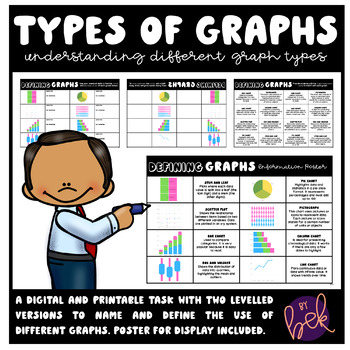
Types of Graphs | Identifying Names & Purpose | Printable & Digital
Types of Graphs Identifying Names & Purpose This task was designed as a "tuning in" to graphs task. Students have the opportunity to complete this task in two ways, either researching for themselves or using the provided definition cards to cut and paste. By completing this task students will have a resource to look back on when deciding which graph is best for their work/project. You'll get:1 research based template1 cut and paste templateA link to the GoogleSlides file for digital useHow t
Subjects:
Grades:
3rd - 6th
Types:
Spreadsheet Graphing Project
From this project, your students are given the opportunity to be creative designing online Microsoft Excel data tables and graphs. It requires them to research in the stock market about various companies. This package includes the following:(1) Teacher instructions;(2) Student instructions;(3) Student samples;(3) Grading rubric; and(4) 3 practice activities creating online data tables and graphs
Subjects:
Grades:
6th - 8th
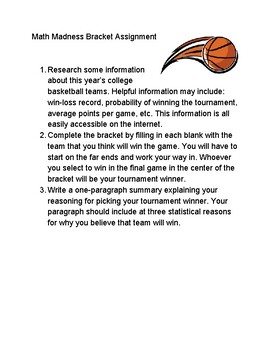
Math Madness Basketball Bracket Challenge with Research and Writing Assignment
This is a fun way to get students interested in math during the college basketball tournament. Students compete to create the best the tournament bracket using mathematical research. Assignment also includes a written portion of their explanation. Includes an example. This item included in all math madness bundles. For more basketball themed math items, visit my store!
Subjects:
Grades:
6th - 12th
Types:
Also included in: Math Madness: Bivariate Data in Basketball
Statistics Project
Use this product as a culmination of your statistics unit. Allow students to create their own question, survey their classmates, and analyze the results. This resource includes pages on - statistical questions - data collection - line plots - histograms- frequency tables - mean, median, mode, range- written conclusion - rubric
Subjects:
Grades:
5th - 7th
Types:
Also included in: Sixth Grade Math Bundle

End of Year Project
There are 3 projects in this bundle. I let students choose which option they wanted to do for their end of the year project.
The 1st project is creating a zoo with given parameters.
The 2nd project is determining who the best major league baseball player currently in the major leagues is based on research students conduct.
The 3rd project is creating a board game based on different parameters which must include a math concept from the school year.
These are great as end of unit projects or
Subjects:
Grades:
5th - 9th
Showing 1-24 of 51 results


