57 results
High school statistics laboratory pdfs
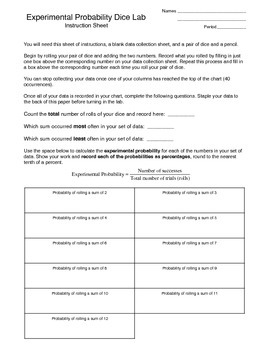
Experimental Probability Activity (dice lab)
In this activity students work with a partner to roll a pair of dice (many times) and record the sum of the dice in a data collection sheet. Once the data has been collected the students are walked through the process of calculating the experimental probability for each sum and then the theoretical probability for each sum and are asked questions about the differences they find between the values. Students also make a bar graph using the percentages for theoretical probability and can visually s
Subjects:
Grades:
7th - 11th
Types:
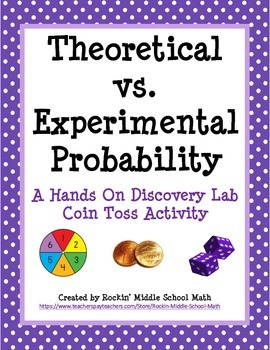
Theoretical vs Experimental Probability Lab (includes making predictions)
This is a fun, student-centered activity in which students working with a partner will conduct an experimental lab tossing 2 coins. After completing the lab, they will draw conclusions based upon the results of the activity concerning the difference between theoretical and experimental probability. Then they use experimental probability to make predictions. I have included the lab activity, a follow-up worksheet which can be used to engage student discussion after the lab, and a worksheet for
Subjects:
Grades:
6th - 9th
Types:

Sickle Cell Data Analysis: Hardy-Weinberg and Chi-Square
Want a great way to convert the "traditional" Hardy-Weinberg lab into a data problem set? Here it is! This is ideal for very small classes, where sample size could be an issue, busy classes, where you may need this for additional at-home practice, or very large classes, where the swapping of H-W cards could get too messy.Included is the full data problem set and teacher pages with the answer key.This data problem set covers:-genotypes and phenotypes-the Hardy-Weinberg equation, with application
Subjects:
Grades:
10th - 12th, Higher Education
Types:
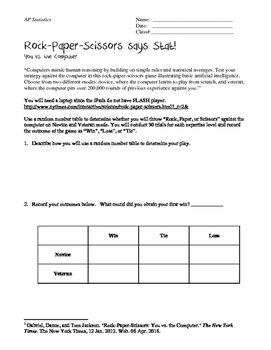
Rock, Paper, Scissors says Stat: A Chi-Square Lab
Students will utilize a Rock, Paper, Scissors website provided by the New York Times to determine whether the computer throwing Rock, Paper, Scissors is truly random. Students are asked to play the game 30 times in both modes. In addition, students are asked to call back ideas of simulation and probability to review previous learned concepts in preparation for the AP Exam to eliminate the confounding variables associated with human behavior.Please find an updated link to the simulator here: ht
Subjects:
Grades:
9th - 12th, Higher Education
Types:
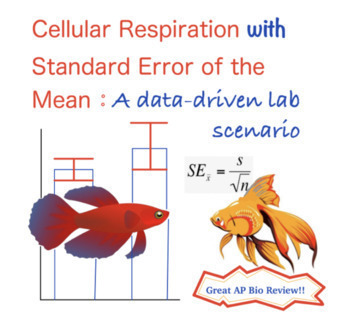
Cellular Respiration Think-it-Through Lab with Standard Error
This activity allows students to review basic concepts of cellular respiration in the context of a lab scenario. Students will work with data and complete calculations including percent change, mean, standard deviation, and standard error. In addition, students will see how error bars are drawn and learn how to interpret them on a graph. Activity A: Introduction (background, lab design, etc)Activity B: Working with data (percent change and mean calculations)Activity C: Calculating standard e
Subjects:
Grades:
9th - 12th, Higher Education, Adult Education
Types:
Also included in: Cell Resp Think-It-Through Lab with Standard Error and Answer Key
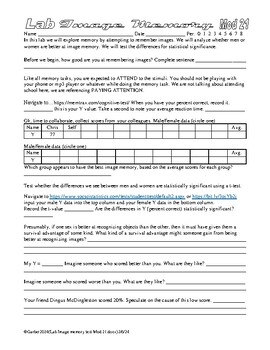
Psychology Lab Image Memory and Sex Differences AP Psychology Statistics
In this set of 13 labs the students do a variety of image memory tasks. They then collaborate and share data, then perform a T test on the data to find out if the differences between the scores of men and women are statistically significant. The students also test for correlations between a variety of scores. I suppose it is a sort of an expansion on my face memory lab. Links sometimes die, so try before you buy… https://www.psychologytoday.com/us/tests/iq/memory-test https://memtrax.com/cogniti
Subjects:
Grades:
9th - 12th, Higher Education, Adult Education
Types:
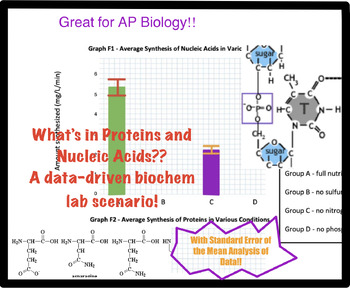
Proteins & Nucleic Acids - What's in Them? Biochem analysis w/ Standard Error
This activity allows students to review basic information related to the 4 classes of biological macromolecules and carbon before exploring the chemical composition of proteins and nucleic acids in this "minds-on" data-driven activity. Students will work with data and complete calculations including percent change, mean, standard deviation, and standard error. In addition, students will see how error bars are drawn and learn how to interpret them on a graph, ultimately reaching conclusions abou
Subjects:
Grades:
9th - 12th
Types:
Fidget Spinner Math Investigation Scatter Plots and Data Displays
This pack contains two awesome activities involving the latest fad that is driving teachers CRAZY in middle school classrooms: FIDGET SPINNERS:
TWO Activities are contained in this pack!
Activity 1 is geared towards 8th grade students who have already studied scatter plots and interpreting correlations. In this activity students will collect data and compare the weight and time spinning of a fidget spinner. Materials required: scale, stop watch, and of course fidget spinners!
Activity 2 can b
Subjects:
Grades:
6th - 9th
Types:
CCSS:
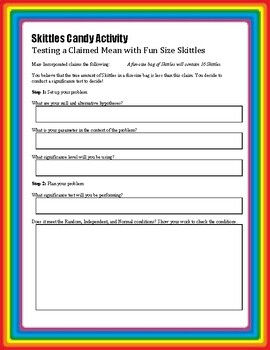
Statistics: Testing a Claimed Mean with Skittles
Each student will need a fun-sized bag of Skittles. They will count the number of Skittles in their bag and along with their classmates' data run a hypothesis test to test if the company's claimed amount of Skittles per bag is correct.
Subjects:
Grades:
10th - 12th
Types:
Binomial Distribution Activity: Yellow Pom Poms
Students will apply what they have learned about binomial distributions to the distribution of yellow pom poms in a jar of multi-colored pom poms.
Subjects:
Grades:
10th - 12th
Types:
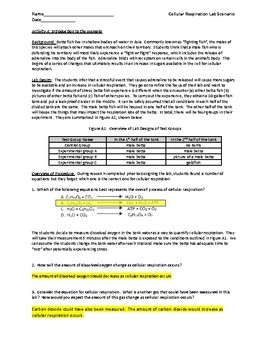
Cellular Respiration Think-It-Through Lab Answer Key
This is the answer key to the Cellular Respiration Think-It-Through Lab with Standard Error of the Mean, available here:https://www.teacherspayteachers.com/Product/Cellular-Respiration-Think-it-Through-Lab-with-Standard-Error-7816492It contains all answers to the calculations, graphs, and suggested answers to the lab conclusion questions.
Subjects:
Grades:
9th - 12th
Types:
Also included in: Cell Resp Think-It-Through Lab with Standard Error and Answer Key
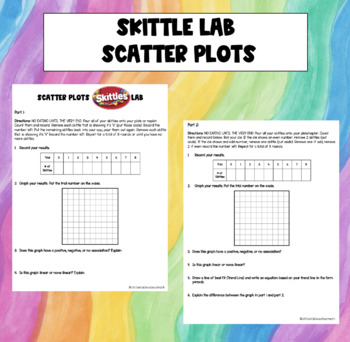
Skittles Lab - Scatter Plots
In this lab, students will be creating data that they can use to create scatter plots and either demonstrate their understanding of scatter plots or discover new learning about scatterplots. Students will be creating two different scatter plots based on their skittles in their cup. They will follow directions and plot the data they create. The first part has students analyzing the trend of their data (positive, negative, no association) and describing the shape of the data. The second part of t
Subjects:
Grades:
7th - 9th
Types:
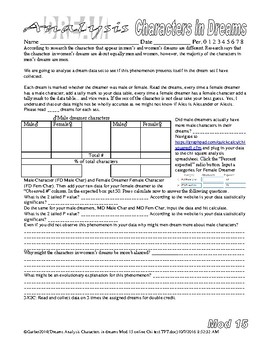
Psychology Dream Analysis Characters and Emotions in Dreams Freud
In these two labs the students analyze a dream set for characters, emotions and animals in dreams respectively. Research says that the characters in women’s dreams are about 50/50, men and women, but in men’s dreams there are more male characters than female characters. One of the labs focuses on this phenomenon. We endeavor to see if this is true in our dream set. The second lab focuses on whether whether or not men or women have more negative or positive dreams. 11/8/22 Animals in dreams is no
Subjects:
Grades:
10th - 12th, Higher Education
Types:
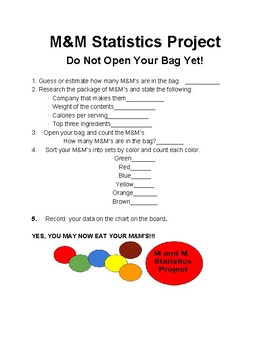
M&M Statistics Project
This is a great hands on project for the class that likes to keep active. The students will be given a bag of M&M's and make some predictions. Then data will be collected. Students will then find MEAN, MEDIAN, MODE, THE LOWER QUARTILE, THE UPPER QUARTILE, RANGE, INTERQUARTILE RANGE. Then the students will construct a box and whisker plot with the data. To conclude the project they will compile a powerpoint and include charts from excel or google sheets. A rubric is included for grading
Subjects:
Grades:
7th - 9th
Types:
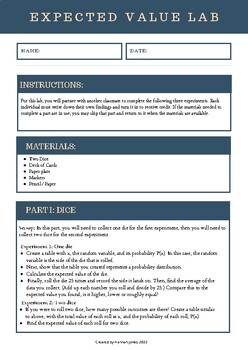
Expected Value Lab
Students will test out the difference between theoretical and experimental probability in this expected value lab!
Subjects:
Grades:
9th - 12th
Types:
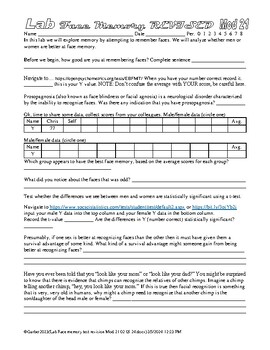
Psychology Lab Face Memory and Sex Differences AP Psychology Statistics
2/5/24 Updated link in lab. Did not update link in sample.In this lab the students do a face recognition activity on a website. They then collaborate and share data, then perform a T test on the data to find out if the differences between the scores of men and women are statistically significant. Links sometimes die so try before you buy… https://openpsychometrics.org/tests/EBFMT/ You have managed to find the source of the best Psychology and AP Psychology labs on TPT, go check out my store for
Subjects:
Grades:
9th - 12th, Higher Education, Adult Education
Types:
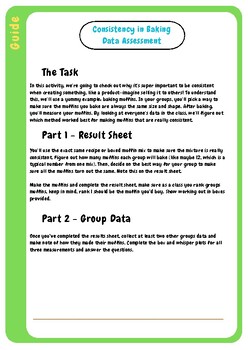
Consistency in Baking: A Data Story
This is a guide on how to use the consistency in baking results & group sheets. This is a statistics assessment:5 number summarymeanrange & IQRStandard deviationbox and whisper plotsYou don;t need to use this as an assessment but it's a great way to teach the importance of data and how it's useful in a commercial setting. This practical will also help students understand mean and standard deviation. i find that students know how to calculate mean, median and mode but no matter how many t
Subjects:
Grades:
6th - 10th
Types:
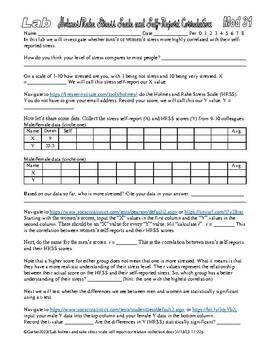
Psychology Lab Stress Correlations 2 AP Psychology Statistics Holmes Rahe
This is another version of my stress correlation labs, it simply relies on a different stress measurement tool.In this collection we make use of the Holmes and Rahe Stress Scale (HRSS) at… https://kresserinstitute.com/tools/holmes/ In this lab the students check the correlation between stress as measured by the HRSS and a variety of self-reports. I have included… Holmes and Rahe Stress and stress self-report Attending and Holmes and Rahe stress correlation Holmes and Rahe Stress and alertness s
Subjects:
Grades:
8th - 12th, Higher Education, Adult Education
Types:
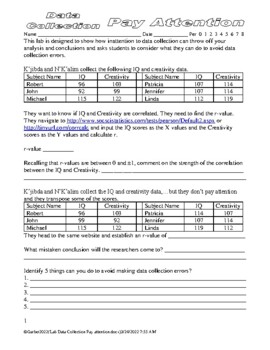
Data Collection: Pay Attention Correlation Statistics Psychology Methods
This lab is designed to show how inattention to data collection can throw off your analysis and conclusions and asks students to consider what they can do to avoid data collection errors. The best part is THAT THEY ARE ALL UNIQUE! Wait, what,…. Every single page is different to minimize copying and cheating! 495 different versions. The students are given a data collection scenario. In the first sample the students use a website to find the r-value of the data. Every assignment has an r-value of
Subjects:
Grades:
9th - 12th, Higher Education
Types:
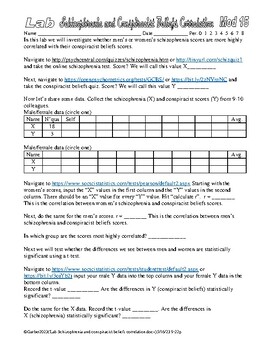
Psychology Schizophrenia and Conspiracist Beliefs Scores Correlation Statistics
In this lab we are finding out if men’s or women’s schizophrenia and conspiracist belief scores are more highly correlated.Students do the schizophrenia quizzes and conspiracist beliefs quiz, collaborate and share data then use a website to conduct the data analysis. It is inspired by this collection… https://www.teacherspayteachers.com/Product/Psychology-Lab-Trolley-Problem-Psychopathy-Scores-Correlation-Statistics-9499523 and the other correlation stuff I have set up…(I have a bunch, these are
Subjects:
Grades:
9th - 12th, Adult Education
Types:
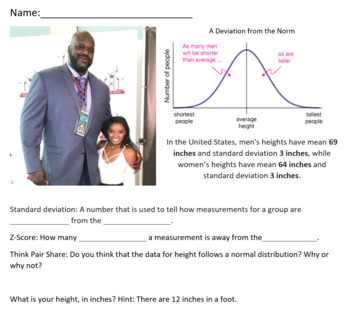
A Deviation From The Norm
This lesson teaches students how to apply information about normal distributions, means, standard deviations, and z-scores from real life data about height. The focus of this lesson is conceptual understanding; students will not be computing any standard deviations. However, they will use a given mean, standard deviation, and normal distribution to compute z-scores and percentiles for their own height, their classmates' heights, and celebrities' heights.
Subjects:
Grades:
9th - 12th
Types:
CCSS:
Fidget Spinners: Math in Motion
If a fidget spinner is better at holding a student’s interest than my math lesson, it’s not the fidget spinner than needs to go! Let’s use them to help the students see the math in their everyday life math in a fun and engaging way. Students will gather and interpret data, convert measurements of time, graph data, and even use online software if you wish.As a “S.T.E.M. in Action” lesson, you’ll find all four components of a true S.T.E.M. curriculum represented.Science — Students design an experi
Subjects:
Grades:
6th - 9th
Types:
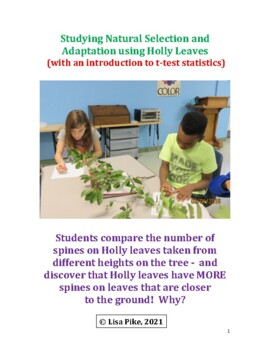
Holly Leaf Spines: an example of natural selection and adaptation
In this lab we will answer the question: Is the number of spines the same on leaves found at all heights on the Holly tree? Holly is just one example of the fluctuations in shape and form of an organism; the variation that any species can exhibit. It is important to recognize that this variation, or plasticity, is normal, and often relates to different environmental conditions (including competition and predation). The ability of an organism to change its characteristics in response to environ
Subjects:
Grades:
6th - 12th, Higher Education
Types:
NGSS:
HS-LS4-3
, HS-LS4-4
, MS-LS4-4
, MS-LS4-6
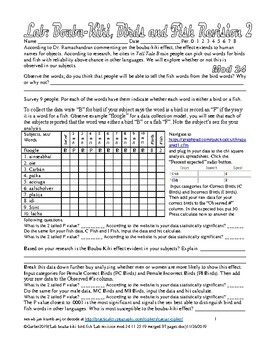
Psychology Lab Bouba Kiki Bird Fish lab Cognition Language
According to Dr. Ramachandran, commenting on synesthesia and the bouba-kiki effect, the effect extends to human names for objects. According to research he cites in Tell Tale Brain, people can pick out words for birds and fish with reliability above chance in other languages. We will explore whether or not this is observed in our population.Survey 24 non-psych friends. For each of the words have them indicate whether each word is either a bird or a fish.This is cool because my students almost al
Subjects:
Grades:
9th - 12th, Higher Education, Adult Education
Types:
Showing 1-24 of 57 results


