12 results
Computer science Common Core HSS-ID.A.1 tools for common cores
Sponsored

One Variable Statistics with R Studio Computer Programming
This is a Unit on Variable Statistics using the free computer programming language R Studio. The unit features 8 lessons, 2 quizzes, and one test.Each lesson has a student google document, a teacher lesson plan, a google slides with help videos for each lesson, and R Studio Code for the lesson.The lessons cover and introduction to R Studio Programming, Data Types, Numeric Data Visualizations, Outliers, Shapes of Distributions, Spreads of Distibutions, Standard Deviation, and Comparing Data Sets.
Subjects:
Grades:
7th - 12th
Types:
CCSS:

One Variable Statistics with Python Computer Programming
This is a Unit on Variable Statistics using the free computer programming language Python which is available free using Google Colaboratory. The unit features 8 lessons, 2 quizzes, and one test. Each lesson has a student google document, a teacher lesson plan, a google slides with help videos for each lesson, and a python notebook with Python Code for the lesson written in Google Colaboratory.The lessons cover and introduction to Python Programming, Data Types, Numeric Data Visualizations, Out
Subjects:
Grades:
7th - 12th
Types:
CCSS:
Common Core Algebra I - Unit #10.Statistics
Standard statistical displays of data are reviewed at the beginning of the 10 lesson unit. Box plots are used to compare data sets and emphasize use of the quartiles and interquartile range. Measures of central tendency and dispersion, such as mean and standard deviation, are discussed and interpreted in real world scenarios. Two way frequency charts are used to compare data and bivariate data analyses allow the fitting of data with linear and exponential functions.To access the lesson videos on
Subjects:
Grades:
8th - 10th
CCSS:
Statistics and Probability CCSS checklist (trimesters)
This document is a checklist for the Statistics and Probability Common Core State Standards framework. There are multiple columns included to be able to use this document as a checklist for which common core standards you have taught within your course(s) and a column to notate when, how, where you used each standard. This is very useful for planning and implementation of curriculum on an annual basis.
Included in the document are the Standards for Mathematical Practice as well as the CCSS fram
Subjects:
Grades:
9th - 12th, Staff
CCSS:
Statistics and Probability CCSS checklist (quarters)
This document is a checklist for the Statistics and Probability Common Core State Standards framework. There are multiple columns included to be able to use this document as a checklist for which common core standards you have taught within your course(s) and a column to notate when, how, where you used each standard. This is very useful for planning and implementation of curriculum on an annual basis.
Included in the document are the Standards for Mathematical Practice as well as the CCSS fram
Subjects:
Grades:
9th - 12th, Staff
CCSS:
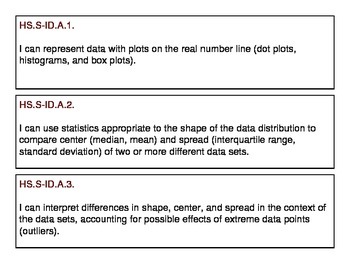
High School Probability and Statistics Concept "I Can" Statement Strips
This file contains all of the CCSS for the "Probability and Statistics" conceptual category in grades 9-12. This PDF can be printed and cut out to post for daily lessons. They will fit a pocket chart or you can add magnets to the back and display them on a magnetic whiteboard. Tabulated sections will keep your strips organized. They will fit perfectly in a file folder system or even a shoebox.
Subjects:
Grades:
7th - 12th
CCSS:
Ohio Learning Standards (OLS) for Stats + 'I Can' Statements
Are you required to use the content standards on your lesson plans? And the 'I Can' statements? This product lists the 8 Mathematical Practices, an overview of the Statistics Learning Standards, and then the standards, each one accompanied by an 'I can' statement. The OLS are almost exactly the same as the Common Core State Standards, but for a little bit of the language and the notation. Oh, and this is FREE!
Grades:
10th - 12th
CCSS:
SPSS software Secondary Data Analysis Workshop (Introductory/AP Statistics)
This handout is intended for those interested in teaching/learning basic introductory statistics concepts to analyze real data. Students will learn how to tell a story using secondary data analysis. The handout is for SPSS and the US Longitudinal Study of Adolescent Health data set. For handouts on the data set code book and raw data file, a PowerPoint to accompany the handout, or questions please email kristin.flaming@gmail.com or ldierker@wesleyan.edu.This handout was developed as a condensed
Subjects:
Grades:
6th - 12th, Higher Education, Adult Education
Types:
STATA software Secondary Data Analysis
This handout is intended for those interested in teaching/learning basic introductory statistics concepts to analyze real data. Students will learn how to tell a story using secondary data analysis. The handout is for STATA software and the US Longitudinal Study of Adolescent Health data set. For handouts on setting up an account, the data set code book and raw data file, a PowerPoint to accompany the handout, or questions please email kristin.flaming@gmail.com or ldierker@wesleyan.edu.This
Grades:
6th - 12th, Higher Education, Adult Education
Types:
SAS software Secondary Data Analysis Workshop (Introductory/AP Statistics)
This handout is intended for those interested in teaching/learning basic introductory statistics concepts to analyze real data. Students will learn how to tell a story using secondary data analysis. The handout is for SAS (email for R, SPSS, Stata, & Python), a free cloud based system and the US Longitudinal Study of Adolescent Health data set. For handouts on setting up a free SAS account, the data set code book and raw data file, a PowerPoint to accompany the handout, or questions please e
Grades:
6th - 12th, Higher Education, Adult Education
Types:
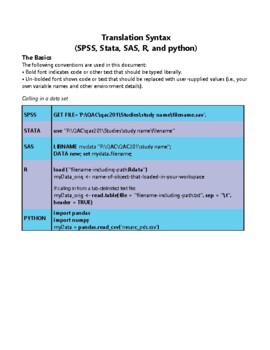
Translation Code
As part of our NSF-funded passion-driven statistics project, we have just started to share more widely our “translation code” aimed at supporting folks in learning code-based software and in moving more easily between them. The pdf includes all of the basic syntax for managing, displaying and analyzing data, translated across SAS, R, Python, Stata and SPSS. http://bit.ly/PDSTranslationCode.For more information about our warm and welcoming data-driven curriculum, check out https://passiondrivenst
Grades:
6th - 12th, Higher Education, Adult Education
Types:
R software Secondary Data Analysis Workshop (Introductory/AP Statistics)
This handout is intended for those interested in teaching/learning basic introductory statistics concepts to analyze real data. Students will learn how to tell a story using secondary data analysis. The handout is for R or R Studio, a free cloud based system and the US Longitudinal Study of Adolescent Health data set. For handouts on setting up a free R account, the data set code book and raw data file, a PowerPoint to accompany the handout, or questions please email kristin.flaming@gmail.com or
Subjects:
Grades:
6th - 12th, Higher Education, Adult Education
Types:
Showing 1-12 of 12 results


