3 results
Adult education Common Core HSS-ID.B.5 lessons

Unit 9: Data and Statistics Fillable Notes
Unit 9: Data and Stats(No 9.3/ Skip)9.1 Central Tendencies: Mean, Median and Mode9.2 Graphical Data: Bar Charts, Dot Plots and Histograms9.3 NONE9.4A 5 number summary and box and whisker plots 9.4B Standard Deviation9.5/9.6 Data Distributions (skewness) left or right9.7 Frequency Tables and relative frequency tablesStudents go over the vocabulary and complete the examples with the vocabulary scaffolded. Notes are scaffolded. Includes hook video hyperlinked on the "learning objective" title. Key
Subjects:
Grades:
6th - 12th, Higher Education, Adult Education

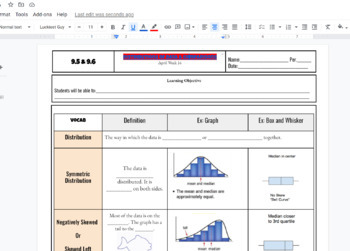
Distributions of Data Scaffolded Fillable Notes (Skewed Left & right) w/ KEY
Distributions of Data Scaffolded Fillable Notes (Skewed Left & right) Includes a problem of creating box plot, bar chart, and dot plot. KEY IS INCLUDED linked at top of title highlighted in red!!! , Algebra 1 or Math 1 class in highschool setting IEP 504 EL learners visuals for better understanding. YOU CAN EDIT THE GOOGLE DOC to your liking!!!
Subjects:
Grades:
7th - 12th, Higher Education, Adult Education
CCSS:

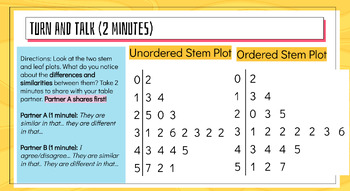
Lesson 1 PowerPoint: One Variable Data for Statistics: Dot Plots, Histograms,etc
This is a lesson (on powerpoint) about statistical distributions. The lesson includes practice problems and vocabulary relating to dot plots, stem plots, and describing/comparing statistical distributions. This is for secondary math (high schoolers). It includes some data collection activities and requires students to get involved in the lesson. If you teach with a tablet, iPad, or smart board, this template is writing-friendly. You can write on the presentation or edit it as you need for your c
Subjects:
Grades:
9th - 12th, Adult Education
Types:
CCSS:
Showing 1-3 of 3 results

