6 results
Statistics Common Core 8.SP.A.3 homeschool curricula

Math Mammoth Grade 8 Complete Curriculum
Math Mammoth Grade 8 is a complete math curriculum for 8th grade mathematics studies. It contains some typical algebra 1 topics, but not all (based on the Common Core Standards for 8th grade (CCS)). You could classify it as an in-between course between traditional pre-algebra and algebra 1.At the heart of the curriculum are two student worktexts (A and B), each covering about half a year of math work. These worktexts contain all the instruction and the exercises in the same book — which make
Subjects:
Grades:
8th
Also included in: Math Mammoth Grades 5-8 Bundle
Math Mammoth Grade 8-B Curriculum
Math Mammoth Grade 8-B is a complete math curriculum for the latter half of 8th grade mathematics studies, based on the Common Core Standards for 8th grade (CCS)).At the heart of the curriculum is the student worktext. The worktext contains all the instruction and the exercises in the same book — which makes lesson preparation a breeze. The worktext is written directly to the student, and thus allows many students to teach themselves and to learn directly from the text.You will also get a separa
Subjects:
Grades:
8th - 9th
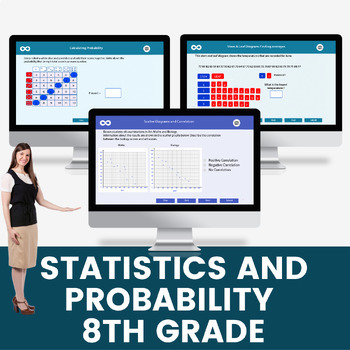
Statistics and Probability Digital Math Lesson and Activities Bundle
This amazing 8th Grade Statistics and Probability Digital Math Lesson and Activities is all you need for your 8th grade math class. From calculating averages using frequency tables to conditional probability, your learners are definitely going to be immersed in their learning! Buy this high-engagement math bundle today and save hours of lesson planning time.Interactive Digital lessons inside this bundle include:Measures of Central TendenciesConditional Probability - Venn DiagramsConditional Prob
Subjects:
Grades:
7th - 8th
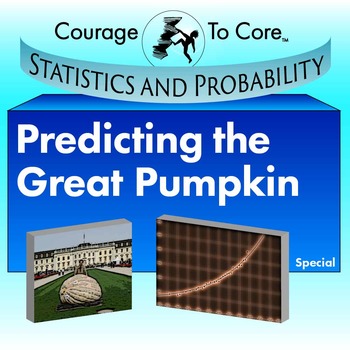
Predicting the Great Pumpkin: 8.SP.A.1...
Students will speculate on the world records for weights of pumpkins. They will graph the data for the records and find the line of best fit. They will either use a graphing calculator or given graphs and functions to explore quadratic and exponential regressions. They will make a short-term prediction about the world record in 2015. This mission is aligned with Common Core Standards: 8.SP.A.1, 8.SP.A.2, 8.SP.A.3.
The fun stuff:
2323 pounds. That’s the weight of a world record for the heaviest
Subjects:
Grades:
7th - 11th
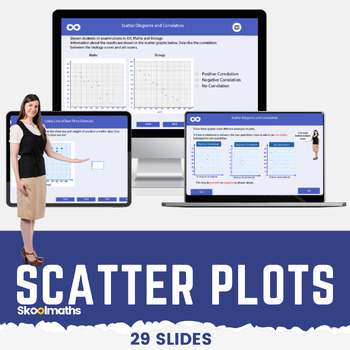
Scatter Plots | Correlation | Line of Best Fit Digital Math Lesson CCSS 8.SP.A.1
Scatter Plots | Correlation | Line of Best Fit Digital Math Lesson CCSS8.SP.A.1Want a high-engagement interactive math lesson that will teach your high school grade how to use and interpret scatter graphs; recognize correlation; draw and use lines of best fit to make predictions?In this lesson, learners will be able to:use and interpret scatter graphs of bivariate data;recognize different types of correlation;draw estimated lines of best fit; anduse lines of best fit to make predictions.The less
Subjects:
Grades:
8th - 10th
CCSS:
Also included in: Complete Statistics and Probability Bundle | Digital and Print
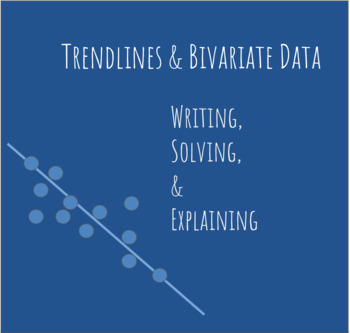
Trend Lines - Writing Equations & Solving - Handout OR Digital!
In this 5 part assignment, students will examine given trend lines and identify the information they need to complete each part. This includes finding starting values, slopes, writing equations and making predictions about unknown values.
Subjects:
Grades:
7th - 8th
Showing 1-6 of 6 results


