8 results
Women's History Month statistics resources for Microsoft Publisher
Easter Math Activities Statistics and Probability Tasks
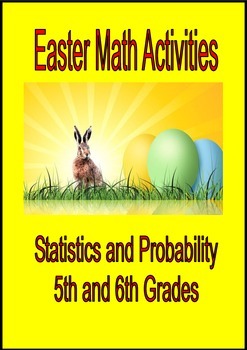
Easter Math Activities Statistics and Probability Tasks
Five fun and exciting Easter activities involving statistics, probability and other calculations.
Task 1: Analysing a pictograph with a scale e.g. 1 egg = 4 people
Task 2: Hot Cross Venn: looking at Venn diagrams in relation to sales of hot cross buns.
Task 3: Chocolate Bunny Chance: looking at most likely/least likely with a bunny full of colored beans
Task 4: Mean, Median and Mode of Easter egg and Easter bunny sales.
Task 5: Easter bu
Subjects:
Grades:
5th - 6th
Types:
AP Statistics Describing Distributions Graphic Organizers (SOCS and FUDS)
This download contains two graphic organizers to help students describe distributions. The first covers SOCS (or SOCV), which can be used to describe the distribution of one variable. Students can use the graphic organizer to summarize the main ideas behind Shape, Outliers, Center, and Spread (or Variability). The second covers FUDS (or DUFS, etc.) that can be used to describe the relationship between two variables. Students use the graphic organizer to summarize the main ideas behind Strength,
Subjects:
Grades:
9th - 12th
Types:
CCSS:
Measure of Position
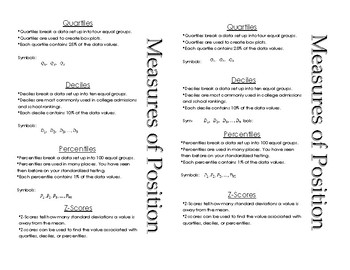
This is a basic outline of quartiles, deciles, percentiles, and z-scores. I use this when I introduce measures of position to my Probability and Statistics classes. We glue it into our Interactive Notebook and include a sample problem to go with each one.
Subjects:
Grades:
11th - 12th
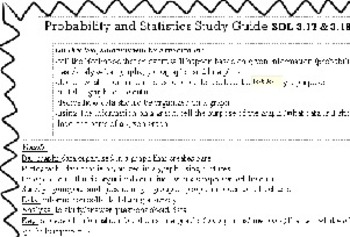
Graphing & Probability Study Guide
This is a study guide that I recently gave my students to help them study for their unit test on graphs and probability. This study guide gives the definitions of: bar graph, pictograph, line plot, survey, data, analyze, key, and probability. Then it has sample problems dealing with the 3 graphs (line plot, picto, and bar) and a few dealing with probability (certain, likely, unlikely, as likely as/equally likely, and impossible).
I have left the study guide in the publisher format in case you w
Subjects:
Grades:
1st - 5th
Types:
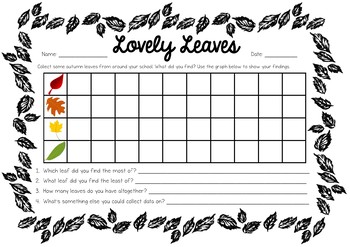
Statistics and Probability Worksheet
Make the most of the beautiful autumn leaves with you class!
Head outdoors and go for a forage for different coloured leaves. Children then sort their leaves into 4 groups (by colour red, orange, yellow and green). Students record what they found on the worksheet provided.
FULLY EDITABLE
Subjects:
Grades:
K - 3rd
Types:

NFL draft averages
Students will research the nfl draft to find the averages of different assessments the draftees go through.
Subjects:
Grades:
4th - 7th
Types:

Sampling Keywords Word Search
A publisher document with a word search for key sampling vocab. It has answers as well.
Subjects:
Grades:
6th - 9th
Types:

Central Tendency
I use this for homework, with one week to complete and usually about 30 minutes in class for questions towards the end of the week. The assignment is designed for students to find mean, median, mode, range, standard deviation, and histograms.
Subjects:
Grades:
6th - 9th
Types:
Showing 1-8 of 8 results


