5 results
Problem solving Common Core 4.MD.B.4 resources for Google Apps

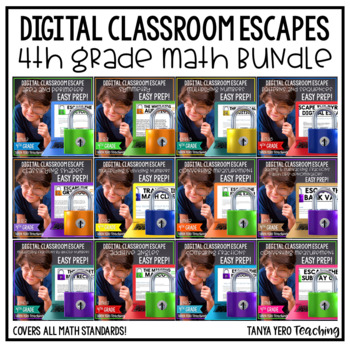
Math Digital Escape Room 4th Grade YEARLONG BUNDLE | DISTANCE LEARNING
This Math Digital Classroom Escape BUNDLE includes interactive activities which promotes peer collaboration and problem solving. Standards based math questions, challenges, and puzzlers combine to create the perfect blend of learning and fun!****SAVE 50% OFF BY PURCHASING THE BUNDLE!****WANT TO TRY OUT A FREE PREVIEW? CHECK OUT THIS FREEBIE ESCAPE CHALLENGE FOR YOUR CLASSROOM! >>>>>>CLICK HERE!!This Tanya Yero Teaching resource can be used in the classroom and/or for distance l
Subjects:
Grades:
4th - 5th
Types:

4th Grade Math Digital Escape Room 4.MD.4 Line Plots
This Digital Classroom Escape is an interactive activity which promotes peer collaboration and problem solving. Standards based math questions, challenges, and puzzlers combine to create the perfect blend of learning and fun!This Digital Escape covers the following math standard: 4.MD.4 - Line PlotsTheme of Escape: Students will need their graphing line plots skills to navigate their way out of being stuck in the 1990's!This Tanya Yero Teaching resource can be used in the classroom and/or for di
Subjects:
Grades:
4th - 5th
Types:
CCSS:
Also included in: Math Digital Escape Room 4th Grade YEARLONG BUNDLE | DISTANCE LEARNING

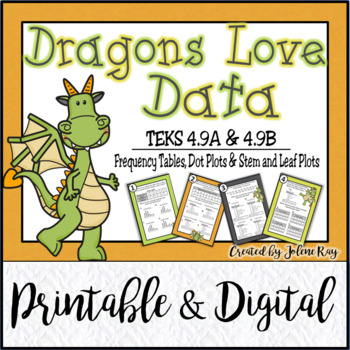
TEKS 4.9A, 4.9B / DATA TABLES / PRINTABLE AND DIGITAL
This product supports the following fourth grade math standards:TEKS 4.9A: represent data on a frequency table, dot plot, or stem-and-leaf plot marked with whole numbers and fractions TEKS 4.9B: solve one- and two-step problems using data in whole number, decimal, and fraction form in a frequency table, dot plot, or stem-and-leaf plot.CCSS 4.MD.B.4: Solve problems involving addition and subtraction of fractions by using information presented in line plots. Printable Resource Includes:18 task car
Subjects:
Grades:
4th
Types:
CCSS:
Also included in: HUGE 4th Grade TEKS - Aligned Growing Bundle

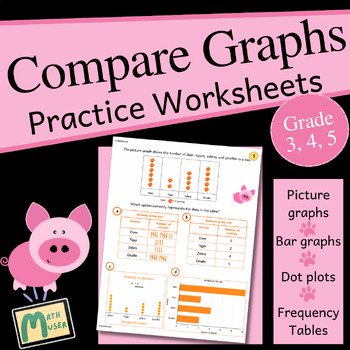
Compare graphs with picture graphs, bar graphs, dot plots and frequency tables
Complement your instruction of picture graphs, bar graphs, dot plots and frequency tables with this set of worksheets that reinforce comparison of information across graph types. Students will compare the same information represented in different graph types identifying missing or incorrect representation. For each type of graph there is a section with 8 worksheets to compare it against other graph types. For example, a set of 8 worksheets are provided to convert picture graphs to bar graphs, do
Subjects:
Grades:
3rd - 5th
Types:

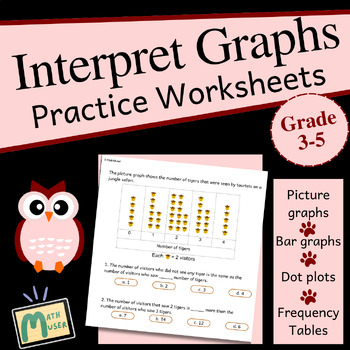
Interpret Graphs Review with picture & bar graphs, dot plots, frequency tables
Your students will love these graphing worksheets for a complete review of picture graphs, bar graphs, dot plots and frequency tables. There are 6 worksheets for each type of graph for a total of 24 worksheets. The graphs include scale factors of 2, 3, 4, 5 and 10. The word problems are focused on interpreting the data and include questions like “how many more”, “which is the highest”, “total number of..”, etc. Each worksheet has 4 multiple choice word problems related to the data in the graph.
Subjects:
Grades:
3rd - 5th
Types:
Showing 1-5 of 5 results

