3 results
Common Core 8.EE.B.6 resources for SMART Notebook

Graphing Lines from an Equation
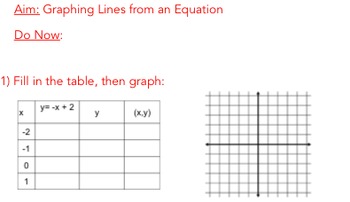
In this smartboard lesson, students will review how to graph lines from an equation in y=mx+b, or slope-intercept form. First students will review how to graph a line using a table by substituting in values. Then, they will practice graphing a line by first identifying the y-intercept and then using the slope to graph several more points. A real-life application problem is also included, as well as examples where either the y-intercept or slope is zero.
Subjects:
Grades:
7th - 8th

Scatter Plot and Slope Foldable
A foldable that shows the similarities of slope and Scatter Plots.
Grades:
6th - 12th
Types:

An Introduction to Graphing Lines Using Slope and Y-Intercept- Grade 8 or 9
This smart notebook lesson introduces graphing lines using the slope and y-intercept. There are 16 total practice problems. The first few involve graphing with a table of values. The next few involve graphing by stating and using the slope and y-intercept. I have my students write the slope as a fraction with directions (ex: up or down/right or left) for each question when they are first learning this concept. I would print out the slides and have your students do the same. There are also
Grades:
8th - 9th
Showing 1-3 of 3 results

