13 results
Higher education Common Core 7.SP.C.7a resources
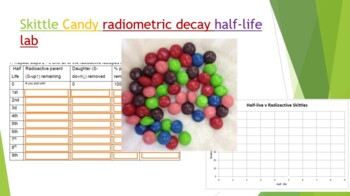
Skittle Radiometric Decay Half-life Lab
Did you know you can use Skittles candy to demonstrate absolute dating and radiometric decay! Buy a 1-4 lb bag at your local bulk warehouse store for savings. This lab is a great way to show how isotopes decay by shaking a plate full of random skittles. Students use Skittles to observe "Isotopes" decay over each half life. At the end of the lab (and only IF they have done all their work) they can enjoy their "daughter products". Skittles were used because they are durable, hypoallergenic, and th
Subjects:
Grades:
8th - 12th, Higher Education, Adult Education
Types:
NGSS:
HS-PS1-8
, HS-PS1-1
, HS-PS1-4
, HS-PS1-6
, MS-PS1-4
...
Also included in: Hands-on Science Semester Labs Bundle
Intro to Probability Worksheet Bundle + Empirical & Theoretical Probability Lab
The following worksheets provide an introduction to probability suitable for a college course in quantitative literacy as well as a discussion of probability in middle or high school.The worksheets include topics in empirical and theoretical probability, odds, expected value, tree diagrams, and probabilities with "and" & "or".If you are not interested in all worksheets, please feel free to check out their individual listings below:Empirical and Theoretical Probability WorksheetOdds Against a
Subjects:
Grades:
8th - 10th, Higher Education
Types:

Introduction to Probability Lesson using Fair Games
This is an activity-based lesson on basic probability, chance, and operations including addition, multiplication, and equivalent fractions. It can be used with a wide variety of grade levels including elementary, middle, and high school as well as with adults. The game approach is one that students LOVE and can be revisited over and over in a scaffolded lesson design to build understanding of probability and chance. It does not require a lot of materials so it is low cost.
You can see a full
Subjects:
Grades:
2nd - 12th, Higher Education, Adult Education
Types:
6 Editable Bar Graph Templates 2.0
Finally a simple and professional graph space that students can fill out without any design issues getting in the way. This file contains 6 ready-to-use graph options. Print them and have students fill them with pencil and ruler, or distribute them over computer and let them practice entering the data. Get a project perfect finish every time. Maybe you just want to fill it out live on a projector? The possibilities are endless! It's okay to say you love these bar graphs. So do we.Contains:- 2 bl
Micro:bit An Introduction
In these lessons you will use the Micro:bit simulator to create a coin toss game and a dice game. Use these games to teach randomness and probability. The skills learned in the simulator are fully applicable to the physical Micro:bit.
Grades:
2nd - 12th, Higher Education, Adult Education, Staff
Types:
Math Notebook
My students call this their "Math Bible". It has a one page of notes for each lesson of Pre-Algebra.Skills in here are used in 5th-12th grade. & definitely beneficial for homeschool use. I have students either glue them into their own notebook or I will hole punch and have them put into a folder/binder.Other teachers have asked for this notebook to refresh their memory.
Subjects:
Grades:
5th - 12th, Higher Education, Adult Education, Staff
Empirical and Theoretical Probability Worksheet
The attached file is a worksheet designed to give students an opportunity to calculate empirical and theoretical probability. After each main question, students are also asked to identify whether the probability that they just calculated is an empirical or theoretical probability. This worksheet was designed for a college freshman course, Quantitative Literacy, but can easily be used in any course that asks students to differentiate between empirical and theoretical probability and complete basi
Subjects:
Grades:
7th - 9th, Higher Education
Types:
Also included in: Intro to Probability Worksheet Bundle
Passion-Driven Statistics E-book (Introductory/AP Statistics Course Textbook)
Passion-Driven Statistics is an NSF-funded, multidisciplinary, project-based curriculum that supports students in conducting data-driven research, asking original questions, and communicating methods and results using the language of statistics. The curriculum supports students to work with existing data covering psychology, health, earth science, government, business, education, biology, ecology and more. From existing data, students are able to pose questions of personal interest and then use
Subjects:
Grades:
6th - 12th, Higher Education, Adult Education
Types:
SPSS software Secondary Data Analysis Workshop (Introductory/AP Statistics)
This handout is intended for those interested in teaching/learning basic introductory statistics concepts to analyze real data. Students will learn how to tell a story using secondary data analysis. The handout is for SPSS and the US Longitudinal Study of Adolescent Health data set. For handouts on the data set code book and raw data file, a PowerPoint to accompany the handout, or questions please email kristin.flaming@gmail.com or ldierker@wesleyan.edu.This handout was developed as a condensed
Subjects:
Grades:
6th - 12th, Higher Education, Adult Education
Types:
Translation Code
As part of our NSF-funded passion-driven statistics project, we have just started to share more widely our “translation code” aimed at supporting folks in learning code-based software and in moving more easily between them. The pdf includes all of the basic syntax for managing, displaying and analyzing data, translated across SAS, R, Python, Stata and SPSS. http://bit.ly/PDSTranslationCode.For more information about our warm and welcoming data-driven curriculum, check out https://passiondrivenst
Grades:
6th - 12th, Higher Education, Adult Education
Types:
R software Secondary Data Analysis Workshop (Introductory/AP Statistics)
This handout is intended for those interested in teaching/learning basic introductory statistics concepts to analyze real data. Students will learn how to tell a story using secondary data analysis. The handout is for R or R Studio, a free cloud based system and the US Longitudinal Study of Adolescent Health data set. For handouts on setting up a free R account, the data set code book and raw data file, a PowerPoint to accompany the handout, or questions please email kristin.flaming@gmail.com or
Subjects:
Grades:
6th - 12th, Higher Education, Adult Education
Types:
STATA software Secondary Data Analysis
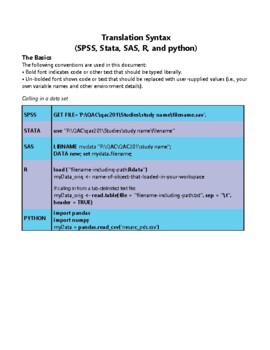
This handout is intended for those interested in teaching/learning basic introductory statistics concepts to analyze real data. Students will learn how to tell a story using secondary data analysis. The handout is for STATA software and the US Longitudinal Study of Adolescent Health data set. For handouts on setting up an account, the data set code book and raw data file, a PowerPoint to accompany the handout, or questions please email kristin.flaming@gmail.com or ldierker@wesleyan.edu.This
Grades:
6th - 12th, Higher Education, Adult Education
Types:
SAS software Secondary Data Analysis Workshop (Introductory/AP Statistics)
This handout is intended for those interested in teaching/learning basic introductory statistics concepts to analyze real data. Students will learn how to tell a story using secondary data analysis. The handout is for SAS (email for R, SPSS, Stata, & Python), a free cloud based system and the US Longitudinal Study of Adolescent Health data set. For handouts on setting up a free SAS account, the data set code book and raw data file, a PowerPoint to accompany the handout, or questions please e
Grades:
6th - 12th, Higher Education, Adult Education
Types:
Showing 1-13 of 13 results

