17 results
10th grade Common Core 8.SP.A.4 resources for Microsoft PowerPoint
Sponsored
ZONK Review Game BUNDLE for 8th Grade Math!
This bundle includes all of my 8th Grade Math ZONK review games for the entire year! Price will increase if more 8th Grade Math ZONK games are added.The following products are included in this bundle:- Rational and Irrational Numbers ZONK (8.NS.1 - 8.NS.2)- Exponents, Radicals, and Scientific Notation ZONK (8.EE.1 - 8.EE.4)- Slope-Intercept Form ZONK (8.EE.6)- Solving Linear Equations ZONK (8.EE.7)- Solving Systems of Linear Equations ZONK (8.EE.8)- Functions ZONK (8.F.1 - 8.F.5)- Transformatio
Subjects:
Grades:
7th - 10th
Maths Jumbo Math Escape Room Bundle (Algebra, Fractions, Geometry, Shape & More)
20 different Math Escape Rooms in this Bundle of escape room challenges / resources and lessons. Maths Jumbo Math Escape Room Bundle (Algebra, Fractions, Geometry, Shape & More). This is a huge collection of unique digital print and play escape rooms. Every student loves to solve a mystery. These new escape room activities will not only improve students knowledge of a wide range of Math topics but will also hone their problem solving skills, build up their teamwork and leadership skills and
Subjects:
Grades:
7th - 11th
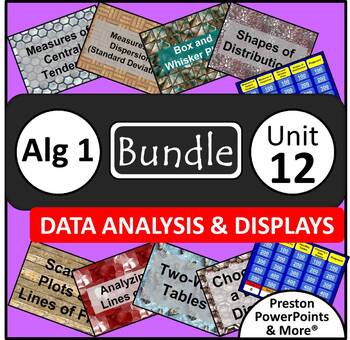
(Alg 1) Data Analysis and Displays {Bundle} in a PowerPoint Presentation
Algebra 1 Data Analysis and Displays {Bundle} in a PowerPoint PresentationThis is a bundle include the eight PowerPoint lessons below and two Quiz Show games, Jeopardy Style, for review.Measures of Central Tendency S.ID.2, S.ID.3Measures of Dispersion (Standard Deviation) S.ID.2, S.ID.3Box-and-Whisker Plots S.ID.1, S.ID.2, S.ID.3Shapes of Distributions S.ID.2, S.ID.3Quiz Show Game Central Tendencies and Dispersion S.ID.1, S.ID.2, S.ID.3Scatter Plots and Lines of Fit 8.SP.1, S.ID.6a, S.ID.6c, S
Grades:
8th - 10th
CCSS:
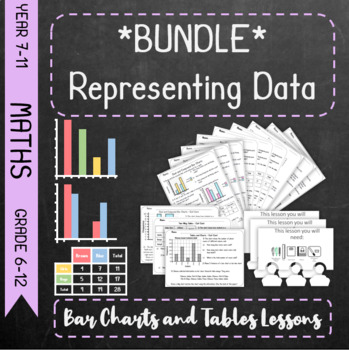
*Bundle* Representing Data - Bar Charts and Tables *Bundle*
This is a bundle featuring the following individual resources:Charts & TablesTwo-Way TablesDual and Compound Bar ChartsThese lessons are based around the scheme of work laid out by the Pearson Key Stage 3 Maths Progress DeltaCharts & Tables - Lesson on Frequency and Tally Tables and Bar ChartsTwo-Way Tables - Lesson on Two-Way TablesDual and Compound Bar Charts - Lesson on Dual/Comparative and Compound/Composite Bar Charts
Grades:
5th - 12th
CCSS:
Scatter Plots Worksheet Complete Lesson Pack (NO PREP, KEYS, SUB PLAN)
Scatter Plots Worksheet - Complete Lesson with No PrepHere’s a Complete Lesson Pack on how to solve Scatter Plots.This Complete Lesson Pack includes the following PDF Files:Lesson PlanPowerPoint PresentationGuided NotesPractice Worksheet (Version A)Practice Worksheet (Version B)Master Quiz*All PDF Files come with Answer Keys for easy grading and teachingIt also includes the following Links:Link to YouTube video that goes with this LessonLink to Online Interactive Quiz that goes with this LessonL
Grades:
6th - 10th
Line of Best Fit Worksheet Complete Lesson Pack (NO PREP, KEYS, SUB PLAN)
Line of Best Fit Worksheet - Complete Lesson with No PrepHere’s a Complete Lesson Pack on how to solve Line of Best Fit.This Complete Lesson Pack includes the following PDF Files:Lesson PlanPowerPoint PresentationGuided NotesPractice Worksheet (Version A)Practice Worksheet (Version B)Master Quiz*All PDF Files come with Answer Keys for easy grading and teachingIt also includes the following Links:Link to YouTube video that goes with this LessonLink to Online Interactive Quiz that goes with this L
Grades:
6th - 10th
Bivariate Data (Linear Regression and Two-Way Tables) ZONK Review Game for 8.SP
Bivariate Review Game Show for 8th Grade Math Common Core State Standards relating to Linear Regression and Two-Way TablesStudents will love this ZONK review game! This review game covers Common Core Standards 8.SP.1, 8.SP.2, 8.SP.3, and 8.SP.4 with the following types of questions:- I can construct and interpret scatter plots.- I can show how straight lines are used to model relationships between two variables. I can solve problems using the equation of a linear model.- I can find the relative
Subjects:
Grades:
7th - 10th
Also included in: ZONK Review Game BUNDLE for 8th Grade Math!
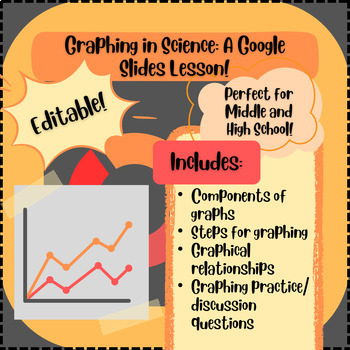
Graphing in Science: A Google Slides Lesson PLUS Guided Notes Handout!
This EDITABLE Google slides (powerpoint) presentation AND guided notes handout covers all of the essential information students need to create and analyze graphs in science. This lesson is designed to refresh students on the concepts of creating graphs using scientific data, analyzing relationships between independent and dependent variables, and includes lots of examples and practice opportunities! This lesson can be used to introduce the important concepts of graphing in science, or it can be
Subjects:
Grades:
5th - 12th, Higher Education, Adult Education
CCSS:
Also included in: Introduction to Science: Unit Bundle! No Prep Required!
Statistics Investigator for Algebra 1 - Power Point
This is the power point presentation that is to help guide the students through a math modeling activity. The students are detectives that determine if a hand, foot, or femur is the best measure of height. It goes along with the handouts that are also listed on my site. The students need knowledge of linear regression, causation vs. correlation, and residuals. This usually takes about 2 days to complete.
Subjects:
Grades:
8th - 12th
CCSS:
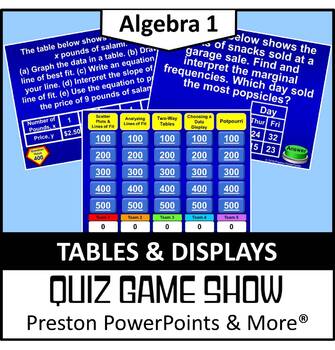
(Alg 1) Quiz Show Game Tables and Displays in a PowerPoint Presentation
Algebra 1 Quiz Show Game Tables and Displays in a PowerPoint PresentationThis Quiz Show game, Jeopardy Style, is a great way to review a chapter. There are 25 questions and a scoreboard so you don’t have to write it on a side board. Each page has the point value!This Quiz Show game covers all of the following:Scatter Plots and Lines of Fit 8.SP.1, S.ID.6a, S.ID.6c, S.ID.7Analyzing Lines of Fit S.ID.6b, S.ID.7, S.ID.8, S.ID.9Two-Way Tables 8.SP.4, S.ID.5Choosing a Data Display S.ID.1NEW: The les
Grades:
8th - 10th
CCSS:
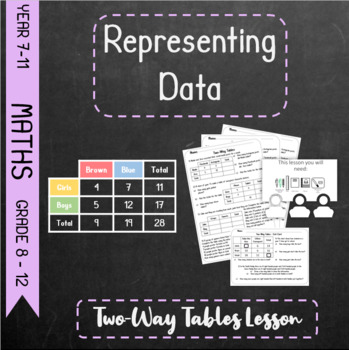
Representing Data - Two-Way Tables Lesson
This resource consists of differentiated lessons, worksheets and print offs. The lessons are a set of 3 differentiations of the same lesson in PowerPoints form as well as a mixed version to allow you to differentiate on the fly. The worksheets are a set of 3 differentiations with some overlap in both PDF and PowerPoint form for easy editting. There is also an undifferentiated exit card for assessment purposes. This is a PDF.Finally there is a variety of print offs that can be used as lesson aids
Subjects:
Grades:
7th - 12th
CCSS:
Also included in: *Bundle* Representing Data - Bar Charts and Tables *Bundle*
Scatterplots Statistics Project Group Presentation Experiment
This project requires students to determine a hypothesis, collect data, make a scatterplot, and analyze the scatterplot for an correlations. Then, students will make predictions, determine if their hypothesis was correct, and present their findings to the class. This project can be used as an independent assignment or as a group project. It can be added to Canvas as a Google Assignment. The project comes with an already made rubric.
Subjects:
Grades:
6th - 12th
CCSS:
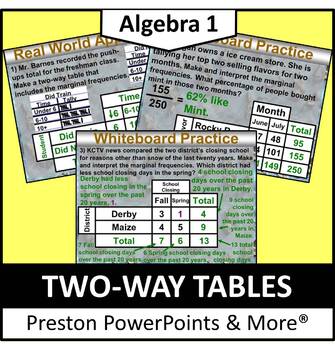
(Alg 1) Two-Way Tables in a PowerPoint Presentation
Algebra 1 Two-Way Tables in a PowerPoint PresentationThis slideshow lesson is very animated with a flow-through technique. I developed the lesson for my Algebra 1 class, but it can also be used for upper level class reviews. This lesson teaches how to read two-way tables, find marginal frequencies, make and interpret two-way tables, and use graphs to organize and solve real-life data problems, such as the most liked movie genre.This lesson has SKELETON NOTES, notes that have the problem only.
Grades:
8th - 10th
CCSS:
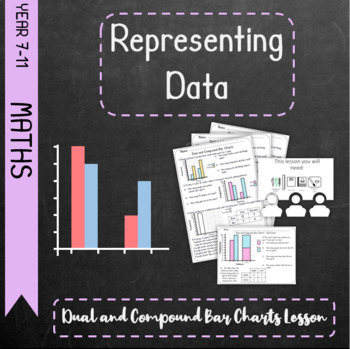
Representing Data - Dual and Compound Bar Charts Lesson
This resource consists of differentiated lessons, worksheets and print offs. The lessons are a set of 3 differentiations of the same lesson in PowerPoints form as well as a mixed version to allow you to differentiate on the fly. The worksheets are a set of 3 differentiations with some overlap in both PDF and PowerPoint form for easy editting. There is also an undifferentiated exit card for assessment purposes. This is a PDF.Finally there is a variety of print offs that can be used as lesson aids
Subjects:
Grades:
5th - 12th
CCSS:
Also included in: *Bundle* Representing Data - Bar Charts and Tables *Bundle*

How did the British Army punish soldiers during WW1? Use Historical Evidence
This lesson teaches students about the use of the death penalty by the British Army during the First World War. The students have a clear idea of the conditions in the trenches and that some men deserted. If they were caught they often faced death by firing squad.This lesson uses real data from the National Archive in England to assess why men were sentenced to death (the different crimes committed) and to use this to infer what the army took most seriously and to think about why. They have to
Grades:
8th - 11th
Also included in: World War One History Bundle
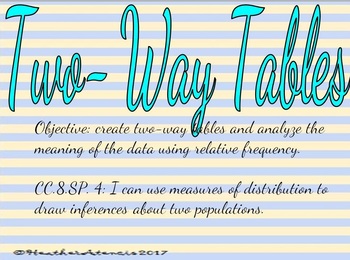
Two Way Tables Lesson
This lesson is presented in power point format. There are vocabulary words that can be added to the Statistics Vocabulary foldable on two slides. The lesson teaches strategies for completing two way tables and analyzing using relative frequency. There is an "exit ticket" on the last slide.
Subjects:
Grades:
8th - 10th
CCSS:
Organizing and Visualizing Data: Population, Sample, Frequency, Graphs and Plots
z
Subjects:
Grades:
8th - 12th
CCSS:
Showing 1-17 of 17 results

