86 results
10th grade Common Core 8.SP.A.4 resources under $5
Sponsored
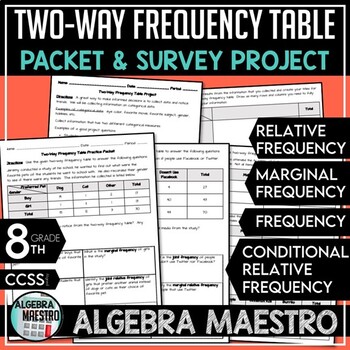
Two-Way Frequency Table Practice Packet & Project
With the Two-Way Frequency Table (or two way tables) Practice Packet & Project you'll receive:-3 pages of student practice via packet-3 pages of the answer key for the packet-2 pages for the student driven projectThe Two-Way Frequency Table Packet and Project are meant to be a review and reinforcement activity. Students can practice and further enhance their understanding using the Packet Practice. Teacher may want to further differentiate the content for advanced students and give them th
Subjects:
Grades:
7th - 12th, Higher Education, Adult Education
Types:
CCSS:
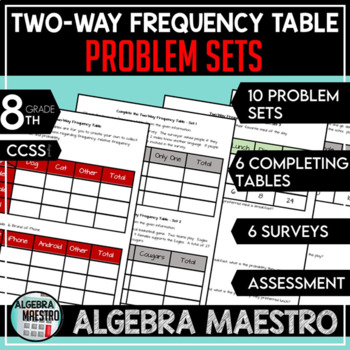
Two-Way Frequency Table Problem Sets
The Two-Way Frequency Table (or two way tables) is designed to give students a lot of practice so they can fully understand and master two-way frequency tables. Included: 10 problem sets (40 total problems), 6 completing tables problem, 6 surveys to collect & analyze data, an assessment, and answer keys to every activity. These are great activities to get students to understand statistics and relationships including ratios, fractions, probability, and develop critical thinking and reasoni
Subjects:
Grades:
6th - 12th, Higher Education, Adult Education, Staff
Types:
CCSS:
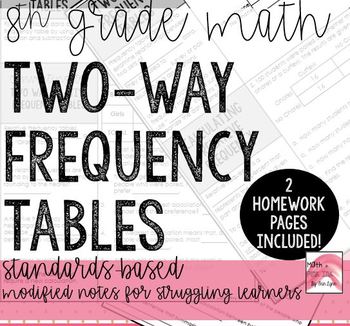
Two Way Frequency Tables and Relative Frequency Notes
NEW AND UPDATED FORMAT*
After careful study I am reformatting my notes to be easier to understand and be better resources for students. They will also more directly address the Common Core standards, and more specifically the Math Florida Standards (my home state).
I have designed this listing to directly address the listed standard for 8th grade, but it could be used in any grade covering frequency tables and relative frequency.
This PDF document contains:
1. Guided, two-column notes format
Subjects:
Grades:
8th - 10th
CCSS:
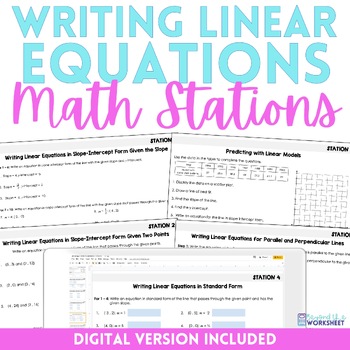
Writing Linear Equations Math Stations | Math Centers
⭐️⭐️⭐️ This set of math stations allow students to practice writing linear equations in a variety of forms. ✅ Stations Included: Writing Linear Equations in Slope Intercept Form Given the SlopeWriting Linear Equations in Slope Intercept Form Given Two PointsWriting Linear Equations in Point Slope FormWriting Linear Equations in Standard FormWriting Equations of Parallel & Perpendicular LinesPredicting with Linear ModelsAnswer keys are included.❤️ A digital version is included as well! Avail
Grades:
7th - 10th
Types:
Also included in: Middle School Math Activities Bundle
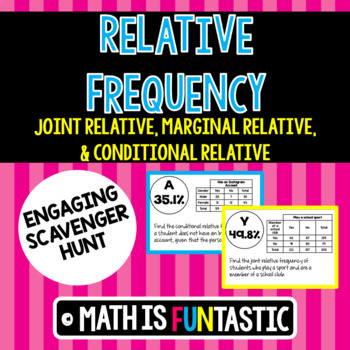
Relative Frequency Scavenger Hunt (Joint, Marginal, & Conditional)
Use this scavenger hunt as a way to get students out of their seat and moving around the classroom! This product contains 15 problems on relative frequency (joint relative, marginal relative, and conditional relative are all included). When students solve a problem, their answer will lead them to the next problem until they have hit all 15 problems. A teacher direction page and recording sheet for students is included in the purchase. You might also be interested in:• Classifying Polynomials Q
Grades:
7th - 10th
Types:
CCSS:
Would You Rather Two Way Tables
Would you rather be rich and fat or poor and skinny? Would you rather have a light saber or helper monkey? Do boys and girls respond differently to such questions? Students will survey classmates and then analyze the results using two way tables. Addresses Common Core Math Standard 8.SP.A.4.
Subjects:
Grades:
8th - 10th
Types:
CCSS:
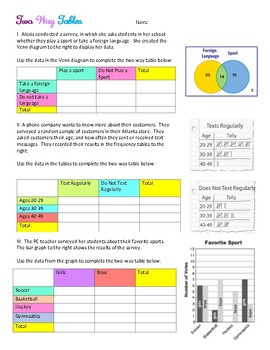
Two Way Tables - Application Activity
This resource allows students to apply what they have learned about two-way tables. Students will be given venn diagrams, tally tables and double bar graphs and will create two way tables from that set of data.
Subjects:
Grades:
7th - 10th
Types:
CCSS:
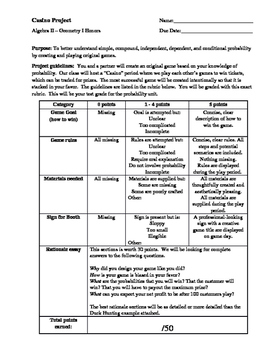
Carnival Probability Project
A project that feels like a game!
Students must create their own game, using probability to ensure THEY are favored to win....much like the house in a casino. Students can make games involving dice, spinners, cards, "fishing" ducks out of a pond, etc.
Assessed skills include: fundamental counting principal, theoretical probability, experimental probability, independent events, dependent events, creativity, writing, presentation. *Students must already know basic probability to complete this
Subjects:
Grades:
8th - 12th
Types:
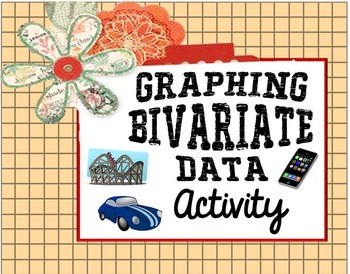
Graphing Bivariate Data Activity
This activity asks students to construct and interpret scatterplots of bivariate data and find associations between the data.
Data Set 1: Top speed and Longest Drop of Top Roller Coasters
Data Set 2: Mileage and Weight of Popular Vehicles
The 3rd part of the activity asks students to conduct a survey, organize it in a table, graph it, and find the association of:
Number of Siblings and Number of Text Messages Sent Per Month
Graphing Bivariate Data Activity by Suzie's Angle is licensed under
Subjects:
Grades:
8th - 11th
Types:
No Prep & Customizable Two Way Frequency and Relative Frequency ESCAPE ROOM
In this digital assignment, students can work in teams or collaboratively to navigate through six puzzles. Each puzzle will challenge them to analyze, interpret and complete frequency tables and compose these analyses into the code they need to crack each puzzle.
Subjects:
Grades:
6th - 10th
Types:
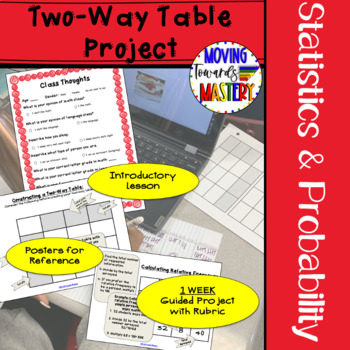
Two Way Frequency Tables End of Year Project Plan
ONE Week guided project plan for constructing and interpreting two-way frequency tables. This engaging project is individualized to allow students to research areas of interest. Can be used year round but is great for an end of year project! Students will gather data on their topic of choice and use the project plan to organize their data into a two way table and frequency table. Students will then analyze the results of the data collection.Two-Way Table Project includes:♦ Suggested Lesson Plann
Subjects:
Grades:
8th - 10th
Types:
CCSS:
Also included in: Middle School Math Projects for End of the Year Activities
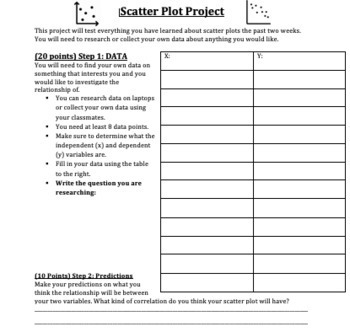
Scatter Plot Project
This is an awesome research project that is summative assessment for a Scatter Plot unit. For this project students are asked to pick a research question about bivariate data, gather the data online or through a survey. Next, they will make a prediction, construct a scatter plot, draw a line of best fit, find the equation of a line of best fit, and answer analytical questions about the data by interpreting the scatter plot. This is a great project that will allow students to utilize technology t
Subjects:
Grades:
7th - 10th
Types:
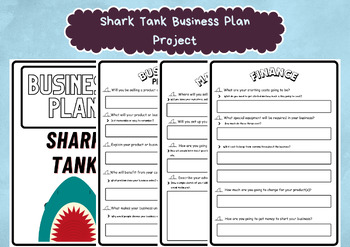
Shark Tank Business Plan Project - Business Strategy Roleplay Game for Kids
Here is what you get:7 pages of Shark Tank Business Plan Project, a fun activity to teach kids about business planning. It can also be a roleplay game where the teacher can be the judge and let students present their projects.All of the products of WorksheetGuardian has been prepared by İrem Kurt, who is the creator of this store.PLEASE NOTE:This is a DIGITAL FILE INSTANT DOWNLOAD only,printable in an array of standard frames sizes.No physical product will be shipped.After checkout you will be d
Grades:
4th - 12th, Higher Education, Adult Education, Staff
Types:
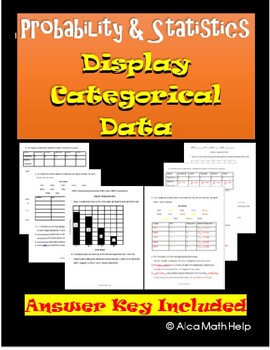
Categorical Data Display Pie Chart & Bar Chart: Worksheet, CW, HW CP & AP Stats
If you are looking for an easy to follow for students. You are at the right place. This is a quick and easy to follow activity sheet that brings across the concept clear and precise. Teachers in my department love this activity sheet. This is useful of CP Probability and Statistics, AP Statistics and Algebra 1 statistics unit. Categorical data and Display Variables ObjectivesAt the end of the lesson students should be able to:1. Correctly define categorical and quantitative data with examples2.
Subjects:
Grades:
8th - 12th, Higher Education, Adult Education, Staff
Scatter Plots Google Slides Activity | Interactive | No Prep | Download and Go!
★ DIGITAL Math Resource★ Are you looking for quality, standards aligned math resources to use with Google Classroom™? This resource is a fun and engaging way for students for practice solving problems involving scatter plots. This product includes a Google Slides activity with 19 interactive slides with questions about scatter plots. Problems cover correlation type, the line of best fit and predicting scatter plot values.To get the complete resource --> CLICK HERE!Possible UsesLesson & pr
Subjects:
Grades:
7th - 10th
Types:
Also included in: Statistics Bundle | Google Slides Activities | Download & Go!
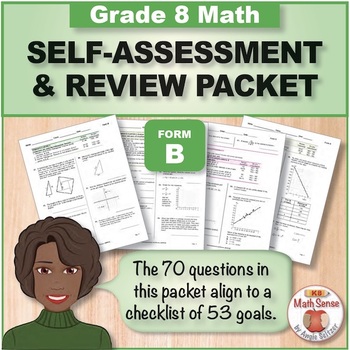
Grade 8 Form B Math Self-Assessment Packet - 70 Questions { Print & Digital }
This packet provides student-friendly goals with related review questions for eighth grade math. This PDF has been prepped as a TpT Digital Activity and already includes answer boxes. Assign them directly to students via TpT and Google Classroom. Parallel versions, Forms A, C, and D enable you to check progress four times during the year. Please see the Preview, which downloads quickly. FEATURES OF REVIEW PACKETS (Forms A, B, C, D)• Self-assessment checklist of goals for each Common Core cluste
Subjects:
Grades:
8th - 10th
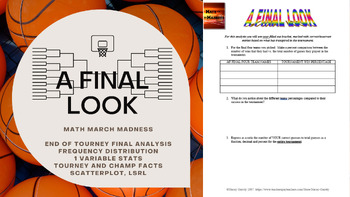
Math March Madness - A Final Look (Freq Distributions, Stats, Regression Lines)
Fill out a bracket, watch the tournament unfold and then mathematically analyze how you did! This activity is flexible enough to be used for a variety of levels. I have used all 6 pages for an AP Statistics class, and have used pages 1 through 5 for an Algebra or Algebra 2 class. You could even use it in lower levels as long as you are covering percents, and basic stats like mean, median, mode and graphing. The document is editable so you can adjust/delete to tailor to the level of statistic
Subjects:
Grades:
4th - 12th, Higher Education
Types:
Constructing and Interpreting Two Way Tables - 8th Grade Math Foldable
This 8th grade math foldable for interactive notebooks provides students with an organized set of practice problems for constructing and interpreting two-way frequency tables. Questions are organized as follows:#1: Fill in missing value to complete the table#2-3: Use the total and percentages to create a table#4-6: Determine whether there is an association between two variables based on the relative frequencies within the table.I use this type of notes during guided instruction.This foldable is
Subjects:
Grades:
9th - 12th
Types:
CCSS:
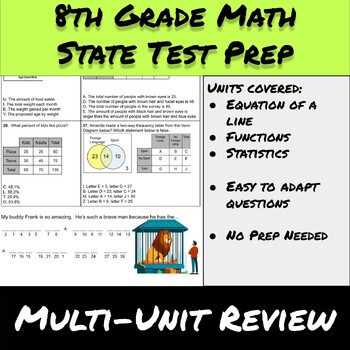
State Test-Multi-Unit Review-Equation of a Line, Functions, Statistics
This self-correcting activity will allow students to review their knowledge of writing the equation of a line, all things functions, and statistics. This review covers many of the most important standards for 8th grade math.In 27 questions students students will practice the following skills:Find slopes and y-intercepts from tables and graphsWrite the equation of a line given: two points, a table, a graphDetermine if a relation is a function or notFind rates of change and initial values for fun
Subjects:
Grades:
7th - 10th
Types:
Also included in: 8th Grade Math-Algebra and Pre-Algebra Whole Course Growing Bundle
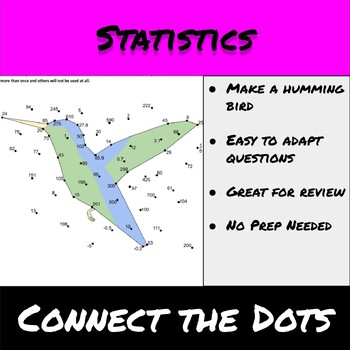
Statistics-Connect the Dots-Scatter Plot and Two-Way Table Review
This connect the dots activity will keep your kids guessing what the shape is until the very end. Mine love to make while guesses while working. The final picture will be a humming bird.Questions too Hard or too Easy? This is provided as a Google Doc and it set up so all questions are easy to adapt for the needs of your students.Students will practice the following skills:Identify the correlation in a scatter plotFind features of scatter plots like gaps, clusters an outliersWrite the equation f
Grades:
7th - 10th
Types:
Also included in: 8th Grade Math-Algebra and Pre-Algebra Whole Course Growing Bundle
Scatter Plots Worksheet Complete Lesson Pack (NO PREP, KEYS, SUB PLAN)
Scatter Plots Worksheet - Complete Lesson with No PrepHere’s a Complete Lesson Pack on how to solve Scatter Plots.This Complete Lesson Pack includes the following PDF Files:Lesson PlanPowerPoint PresentationGuided NotesPractice Worksheet (Version A)Practice Worksheet (Version B)Master Quiz*All PDF Files come with Answer Keys for easy grading and teachingIt also includes the following Links:Link to YouTube video that goes with this LessonLink to Online Interactive Quiz that goes with this LessonL
Grades:
6th - 10th
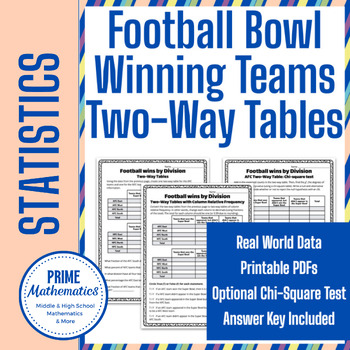
Two-Way Tables of Football Bowl Winners by Division
Use statistics about teams that have appeared in or won the Football Bowl to practice creating and interpreting two-way tables. Teams are categorized by division and whether they have appeared in or won the national pro football championship. Also, chi-square tests are included for higher-level statistics courses like AP Stats.The following topics are covered:Creating Two-Way TablesCreating Two-Way Tables of relative frequency (optional)Interpreting Two-Way TablesChi-square test for homogeneity
Subjects:
Grades:
8th - 12th
Types:
CCSS:
Also included in: Football Bowl Statistics Super Bundle
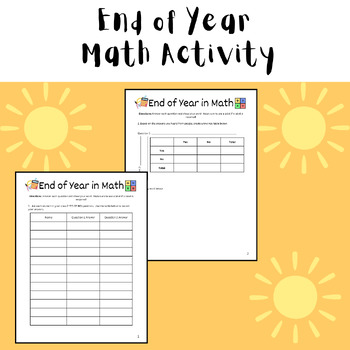
End of Year Math Activity - Printable Resource on Categorical Data
This NO PREP printable resource for middle school math students, can also be used for elementary age students (with scaffolding) or high school students in Algebra, Pre-Algebra, or Algebra 2.These activities includes the following math skills:Data AnalysisBivariate Categorical Data Tables If you are looking for more middle school math activities, try these!Middle School Math Activities - In Our Middle School EraMiddle School Math End of Year Activity - Measurement
Subjects:
Grades:
3rd - 10th
Types:
CCSS:

Create your own scatter plot (Hoilday Style)
This product includes a google slides presentation taking students step by step through a project to create their own scatter plot. The presentation has students create their own scatter plot using something from the hoildays for their data points.
Subjects:
Grades:
7th - 10th
Types:
CCSS:
Showing 1-24 of 86 results

