2 results
Women's History Month graphing classroom form interactive whiteboards

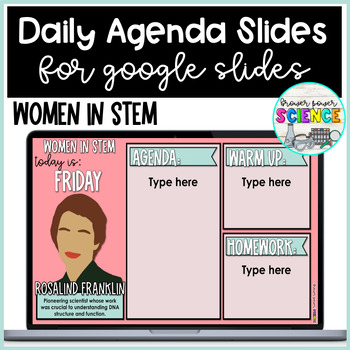
Women's History Month | Daily Agenda Slides | Women in STEM
Are you looking for a way to present your agenda in your classes?! These slides are ready for any STEM class and showcase a woman in STEM each day. Perfect for Women's History Month.This is a Google Slides file with different agenda slides. These are perfect to help organize your agenda for your students and even families. Customize your slides by adding different text boxes and presenting what you need for your students.Use in class while projecting on to your whiteboard, or use remotely by pre
Subjects:
Grades:
Not Grade Specific

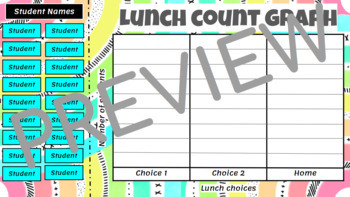
Lunch Count Graph
This is a fun way for students to interact with lunch count. Students will drag their name to their lunch choice, in return they will be creating a graph. This opens up some teaching moments to analyze graphs and data. It would make a perfect morning meeting activity. The teacher could ask questions such as: How many more students want choice 1 over choice 2, How many students are eating lunch provided by the school?, How many more students are getting lunch from school than students who broug
Grades:
Not Grade Specific
Showing 1-2 of 2 results


