10 results
3rd grade other (specialty) resources for Microsoft Excel $10 and up
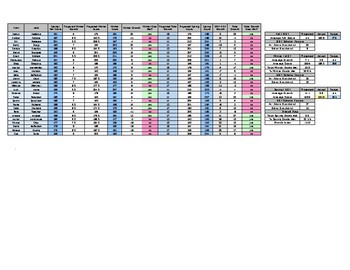
Data Tracker for NWEA MAP / MPG - Tracks growth goals and achievement
This excel tracker will allow you to track your students' progress on NWEA MAP or MPG assessments. It tracks student progress against grade-level benchmarks or goals, and tells you how many students are meeting their individual growth goals. If your school (like mine) uses the assessment without the associated tools and reports, this can be your go-to when tracking data.
You:
- Enter student names
- Enter fall scores (or previous year spring scores if tracking spring-to-spring)
- Enter projecte
Subjects:
Grades:
1st - 6th
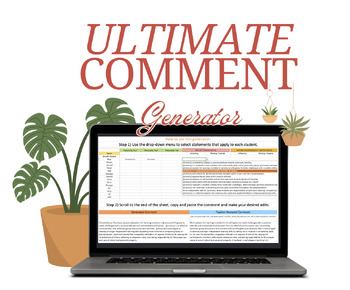
General Report Comment Generator
Introducing the Comprehensive General Report Comment Generator – your ultimate resource for crafting detailed, personalised, and effective report comments that are designed to enhance communication with parents and support student growth. This meticulously curated tool covers a wide range of categories and includes essential components like adjectives, adverbs, phrases, and sentence stems, ensuring you have everything you need to provide insightful and meaningful feedback.Key Features:Opening an
Subjects:
Grades:
K - 12th, Higher Education
Types:
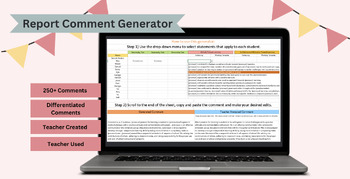
General Report Generator Comment Bank
Introducing the Comprehensive Report Comment Generator – your ultimate resource for crafting detailed, personalised, and effective report comments that are designed to enhance communication with parents and support student growth. This meticulously curated tool covers a wide range of categories and includes essential components like adjectives, adverbs, phrases, and sentence stems, ensuring you have everything you need to provide insightful and meaningful feedback. Key Features:Opening and Closi
Subjects:
Grades:
K - 12th, Higher Education
Types:
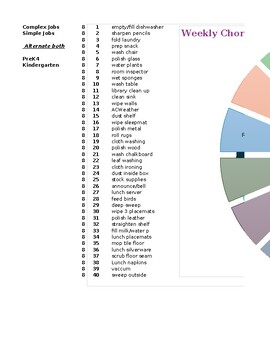
Chore Wheel/Pie chart
This pie chart was designed to be used in a Montessori classroom to assign weekly tasks to students in Practical Life/ chores. This can be downloaded and edited. The outer donut are the student names to be rotated every Monday. The inner donut is related to the list of jobs. They are organized alternating simple and complex jobs so each student can have up to 3 jobs daily. Repetition is the best teacher and will help them perfect and refine their work.
Subjects:
Grades:
PreK - 3rd
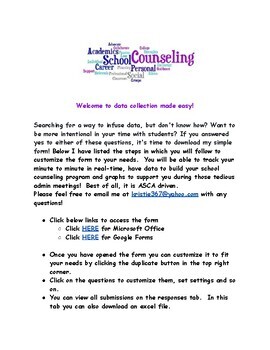
ASCA Daily Data Collection
Searching for a way to infuse data, but don't know how? Want to be more intentional in your time with students? If you answered yes to either of these questions, it's time to download my simple form! Below I have listed the steps in which you will follow to customize the form to your needs. You will be able to track your minute to minute in real-time, have data to build your school counseling program and graphs to support you during those tedious admin meetings! Best of all, it is ASCA driven.
Subjects:
Grades:
K - 12th

Attendance Graphs (for absences and tardies)
The Excel file will, in tandem from your Student Information System, will graph the minutes of instruction that a student has missed up to the date you you choose (we try to use it quarterly). If you have an electronic method of tracking tardies, you can add that data too and the graph will discriminate between minutes/% missed by each. The sheet is set up to graph up to 50 students on this page. The instructions for use on on the second worksheet of the workbook. For absences, your SIS should g
Grades:
PreK - 12th, Staff
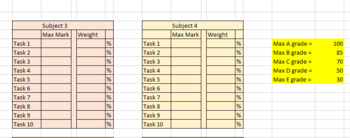
Automated Mark Book - Up to eight subjects/classes
Use this mark book to enter you assessment data for up to 8 subjects or classes. As you enter your student's results, the mark book will automatically calculate weighted totals, final marks, final grades and ranks within the class. You set the maximum assessment mark and weight for each task. You can also adjust your grade scale to suit your school or education system.
Save it on a USB drive and take it with you everywhere. It's easy to use and makes the end of the reporting period a lot easier
Subjects:
Grades:
K - 12th, Higher Education, Adult Education, Staff
Types:
IEP Data Collection FREE Updates
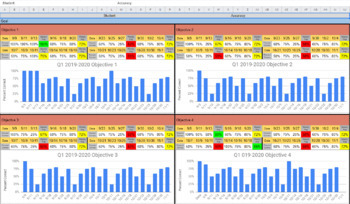
This product can be used to help teachers monitor progress of student IEPs. There are three data points per objective, if you need more feel free to contact me and I can make it happen. If the student's weekly average falls below 50%, it highlights the cell red. If it is between 51%-79%, it highlights the cell yellow. If it is 80% or above, it highlights the cell green. When a student is absent, simply put in A, and the cell will highlight so that you have a visual for how many times the student
Subjects:
Grades:
PreK - 5th
RtI Data Organizer-FULL YEAR
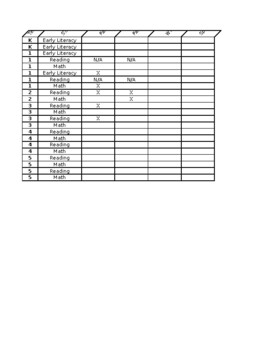
This product is my baby, my pride and joy! I am an RtI Coordinator at a K-5 elementary school who has built our program from the ground up. This product is a workbook with tabs for schedules, attendance, progress monitoring, student information and cycle tracking, guided reading rotations, whole-school intervention schedules, Kindergarten Early Literacy monitoring, watch list for special education evaluations, and anything you could imagine! If you are new to RtI or looking to up your game, this
Grades:
K - 5th, Staff
ABA Autism Graph Template
Easily graph multiple graphs within one single file. Easily shared with parents, administrators and child study teams. Easy to use and professional. American Psychological Association based. Colors can easily be added.
Subjects:
Grades:
PreK - 12th
Types:
Showing 1-10 of 10 results

