161 results
2nd grade statistics internet activity microsofts
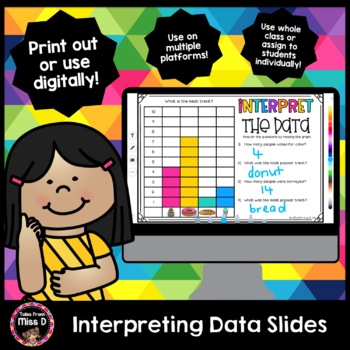
Interpreting Data Slides
Help develop students' ability to collate data and interpret graphs with these slides.There are two styles of questions;Tally - students count the data and use tally marksInterpret a Graph - students read the graph and answer questionsThese slides can be printed out, used in the classroom with your students or uploaded into your digital classroom for distance learning.Have a question? Use the Product Q & A or email me at talesfrommissd@gmail.comRelated ProductsSpin and GraphSight Word Spin a
Subjects:
Grades:
K - 2nd
Types:
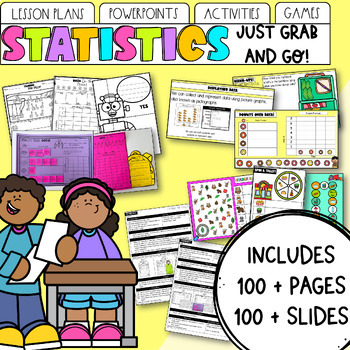
Statistics & Data | Maths Unit: Lessons, PowerPoint, Activities & Games
Looking for statistics and graphing planning that ticks all your boxes? Look no further! Teaching is hard enough, without spending hours creating differentiated lesson plans and activities. Not to mention the time spent planning what your early finishers can do, what assessment points to consider, or sourcing games that consolidate previous skills! With this Statistics and Data Unit, everything is done for you. Want to buy in early to the discounted bundle and get all updates for free? Find my G
Subjects:
Grades:
K - 2nd
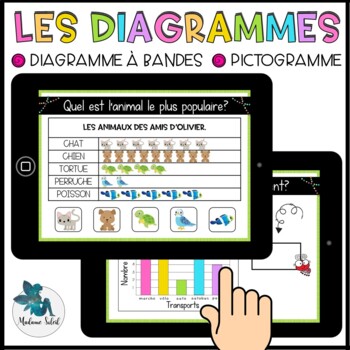
Les diagrammes au 1er cycle Boom Cards French distance learning
French pictograph, french graph. Activité mathématique de statistique permettant de travailler le diagramme, les diagrammes, le pictogramme, les graphiques, l'histogramme ou le diagramme à bande pour des élèves de 1re année, 2e année et 3e année. Super en groupe, en atelier, dans les centres mathématiques, à distance et à la maison. French immersion.Viens l'essayer avant de l'acheter !C'est quoi?20 Cartes Boom dans lesquelles les élèves doivent :- Analyser les diagrammes.- Répondre à la question
Subjects:
Grades:
1st - 3rd
Also included in: Bundle 1re année mai mathématique BOOM CARDS French distance learning
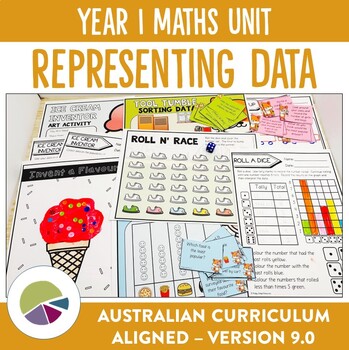
Australian Curriculum 9.0 Year 1 Maths Unit Data
Help your students learn how to apply data skills with this unit plan and activity bundle. Bring your maths lessons to life as the unit plan walks you through everything you need to thoroughly cover the AC9M1ST01 and AC9M1ST02 elements of the Australian Year 1 Maths curriculum (version 9.0). Fun for students, easy for you to implement and an irresistible way to help budding mathematicians learn how to use data in a variety of ways!Bring the fun back into learning about data as you guide your stu
Subjects:
Grades:
K - 2nd
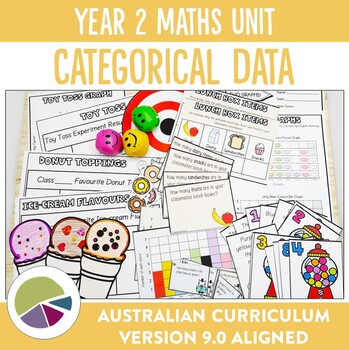
Australian Curriculum 9.0 Year 2 Maths Unit Data
Help your students collect data and interpret graphs with this unit plan and activity bundle. Bring your maths lessons to life as the unit plan walks you through everything you need to thoroughly cover the AC9M2ST01 and AC9M2ST02 elements of the Australian Year 2 Maths curriculum (version 9.0). Fun for students, easy for you to implement and an irresistible way to help budding mathematicians explore data.Bring the fun back into learning about data as you guide your students through the followin
Subjects:
Grades:
1st - 3rd
Also included in: Ultimate Australian Curriculum 9.0 Year 2 Units Bundle
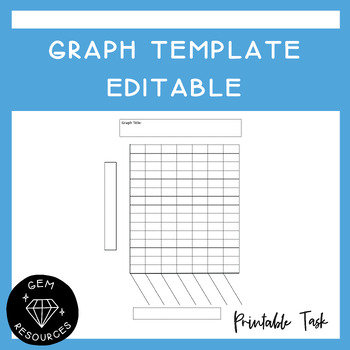
Graph Template Data and Statistics Maths Histogram Bar Column Drawing Editable
Students can use this to help them draw up a graph. It allows them to be accurate and has boxes for the titles needed for the graph.This Word document is editable.
Subjects:
Grades:
2nd - 6th
Types:
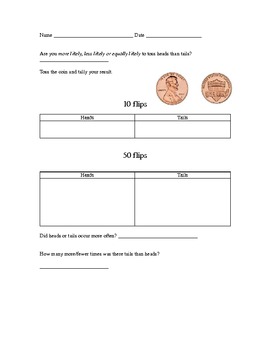
Probability: coin toss and dice roll
Teach probability using a penny and/or a dice. Introduce this probability game using key vocabulary: more likely, less likely or equally likely. Students will be able to practice using tally marks during the recording process.
Students will toss a penny 10 or 50 times and record the number of times heads or tails lands facing up. Students will roll a dice 10 or 50 times and record the number of times a even or odd number lands facing up.
Subjects:
Grades:
K - 4th
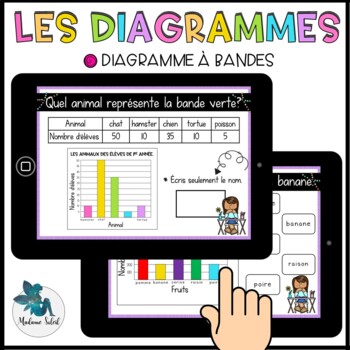
Les diagrammes à bandes en 2e année Boom Cards
French graph. Activité mathématique de statistique et d'enquête permettant de travailler le diagramme, l'histogramme ou le diagramme à bande pour des élèves de 2e année et 3e année. Super en atelier de math, dans les centres mathématiques, à distance et à la maison. Viens l'essayer avant de l'acheter !C'est quoi?20 Cartes Boom dans lesquelles les élèves doivent :- Analyser les diagrammes.- Répondre à la question.DescriptionC'est une activité auto-correctrice avec laquelle l'enfant reçoit une rét
Subjects:
Grades:
2nd - 3rd
Also included in: Bundle 2e année mars mathématique Boom Cards
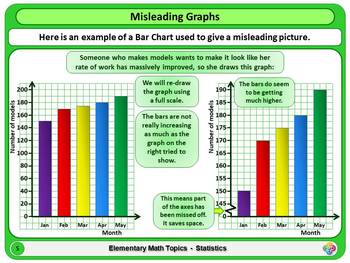
Misleading Graphs for Elementary School Math Powerpoint
A short Powerpoint Presentation to explain misleading graphs.This powerpoint has a title and end slide, as well as the number of slides stated above.You may prefer to purchase this product as part of one of the following two Bundles, which are both available from my shop on this site and offer excellent value:"Elementary School Math Topics: Statistics" (10 powerpoints)"Elementary School Math Topics: The Full Set". (88 Powerpoints)
Subjects:
Grades:
2nd - 5th
Types:
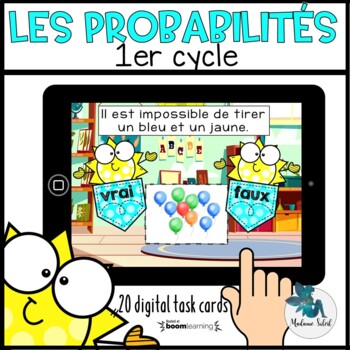
Les probabilités en 1re et 2e année Boom Cards French distance learning
French probability. Activité mathématique pour travailler les probabilités. Le vocabulaire mathématique suivant sera travaillé : possible, certain et impossible à travers des beignes, des ballons ou des dés.Super en grand groupe, en petit groupe, pour le tableau blanc, dans les centres mathématiques, en orthopédagogie, à distance et à la maison.Viens l'essayer avant de l'acheter !C'est quoi?20 Cartes Boom dans lesquelles les élèves doivent :- Déterminer si l'énoncé est vrai ou faux.- Appuyer sur
Subjects:
Grades:
1st - 2nd
Also included in: Bundle 1re année mars mathématique BOOM CARDS French distance learning
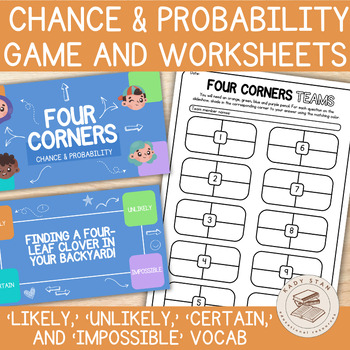
Chance and Probability Game | Slideshow Activity & Worksheets | 2nd Grade Maths
*Topic: Chance and Probability exploring the vocabulary of likely, unlikely, certain, and impossible* Our reimagined Four Corners is a dynamic classroom game where students respond to questions posed by the teacher by physically moving to one of four corners in the room, each representing a different answer option. It's a fun and interactive way to engage students whilst they learn, and you assess their understanding of the topic. THREE WAYS TO PLAY: Traditional Four CornersUtilise a digital de
Subjects:
Grades:
1st - 3rd
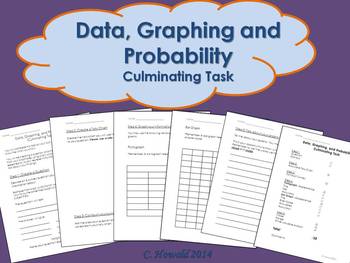
Graphing Unit Culminating Project
I used this activity as a summative assessment for my Data, Graphing and Probability Unit. This gave students the opportunity to create their own question, survey a group of students (visited another class in the school), collect, display and analyze their data.
I have left this as a .doc file so that you are able to adjust it to fit the needs of your classroom.
If you have any questions or concerns, let me know!
Thanks for downloading. Please take the time to rate this product.
If you e
Subjects:
Grades:
2nd - 4th
Types:
Graphing & Probability Jeopardy Review Game
A fun and exciting way for students to review Graphs, Probability, and Combinations/Outcomes. This game is similar to a Jeopardy Game where students will answer the questions to earn points! This game puts a little twist on regular Jeopardy by turning it into what I call "Jailbreak Jeopardy". The students must work to answer the questions before the Math Thief gets away! The team with the most points, puts the Math Thief back in jail and wins the reward! (I usually provide students with a math p
Subjects:
Grades:
2nd - 4th
Also included in: Jailbreak Jeopardy Bundle
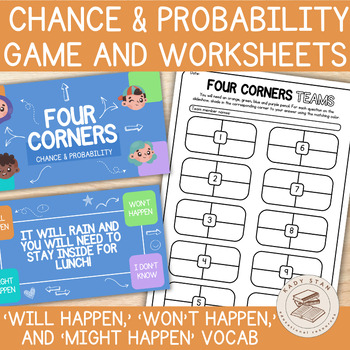
Chance and Probability Game | Slideshow Activity & Worksheets | 1st Grade Maths
*Topic: Chance and Probability exploring the vocabulary of will happen, won’t happen, and might happen* Our reimagined Four Corners is a dynamic classroom game where students respond to questions posed by the teacher by physically moving to one of four corners in the room, each representing a different answer option. It's a fun and interactive way to engage students whilst they learn, and you assess their understanding of the topic. THREE WAYS TO PLAY: Traditional Four CornersUtilise a digital
Subjects:
Grades:
1st - 3rd
Digital Graphing and Survey Slideshow Presentation Using Haiku Deck
Digital graphing project with Haiku Deck works on iPads, computers, laptops, tablets, and Google Chromebooks!
Easily integrate technology into your math centers, small group math instruction, or project-based learning lessons with this low prep, Common Core aligned, differentiated, and engaging activity! Students will use the included planning and direction sheets to generate a question, survey their classmates then create a digital graph and presentation on the free app Haiku Deck.
Haiku D
Subjects:
Grades:
2nd - 5th
Types:
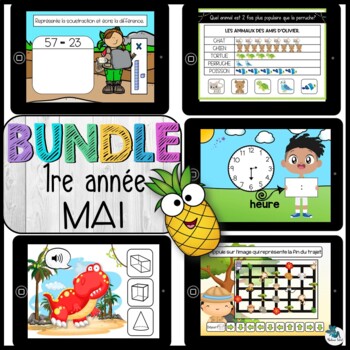
Bundle 1re année mai mathématique BOOM CARDS French distance learning
Bundle de Boom Cards 1re année mathématique de mai sur l'addition de nombres à 2 chiffres avec manipulation, la soustraction sans emprunt, les diagrammes, les pictogrammes, la statistique. lire l'heure, le temps, le trajet ou l'orientation spatiale, les solides, les faces planes et les face courbes, la géométrie pour les élèves de 1re année et de 2e année. Super en atelier, en centre mathématique, à distance ou à la maison. Un total de 100 cartes BoomVoici les 5 tableaux :- Addition et soustract
Subjects:
Grades:
1st - 2nd
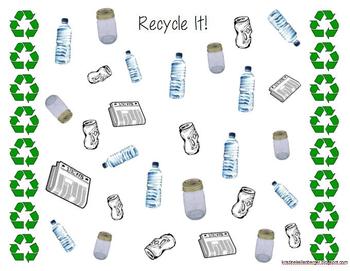
Recycle It! Tally Activity
This is my first worksheet to upload to TPT and I hope you can find it useful!This activity was created to incorporate Earth Day, recycling, and math concepts of tallying and graphing. Use the first page of the various items that we recycle (paper, glass, aluminum, and plastic) as a map to be left at a Math Center. The second page is the students' recording sheet. Students should mark a tally for each item, count the tallies, and then create a graph. There are two versions included, one full col
Subjects:
Grades:
K - 2nd
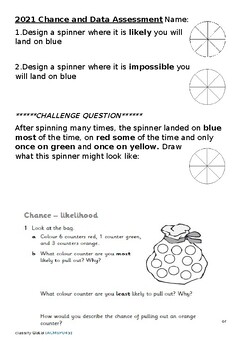
Chance and Data Test Assessment ACARA Year 2 Australia
This is a test that I use with my Year 2 Australian students to assess the ACARA outcomes for the strand Statistics and Probability, Chance and Data. It is a WORD doc, so fully editable. My tests allow for the 5 point scale, so often have harder questions or sums to allow for the higher marks. Students are told these harder questions are optional.The ACARA outcomes are: Identify practical activities and everyday events that involve chance. Describe outcomes as ‘likely’ or ‘unlikely’ and identify
Subjects:
Grades:
2nd
Types:
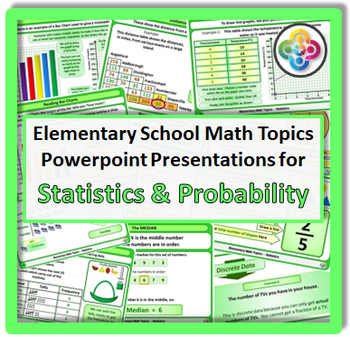
Elementary School Math Topics: STATISTICS & PROBABILITY
This set of 10 powerpoint presentations, covering topics in "Statistics and Probability" is from the product ""Elementary School Math Topics: The Full Set". (88 Powerpoints). You may prefer to buy this complete set, which is available from my shop on this website and is excellent value.The presentations included here (all of which can be purchased individually) are:Bar ChartsDistance TablesLine GraphsMisleading GraphsMode, Median, Mean and RangePictogramsPie ChartsProbabilityTally ChartsTypes of
Subjects:
Grades:
2nd - 5th
Types:
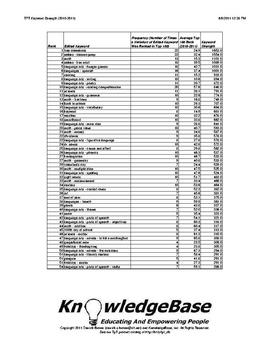
TPT KeyWord Strength Index (2010-2011) - Downloadable Spreadsheet!
What are the strongest keywords on TpT?
1. free downloads
2. Deanna Jump
3. math
Neither #1 nor #2 are surprises, but #3 (math) was certainly a surprise to me!
This report analyzes TpT's 2010-2011 keywords using a measure called "keyword strength".
The measure is based on a keyword's average rank, as well as the number of times it appeared in the 2010-2011 "Top 100" TpT search engine rankings.
This can be a valuable tool to help sellers understand TpT's marketplace supply and demand!
The P
Subjects:
Grades:
PreK - 12th, Higher Education, Adult Education, Staff
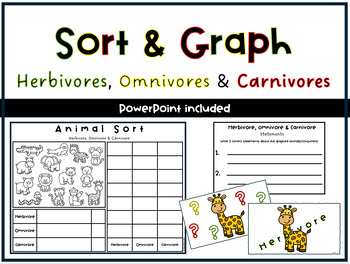
Sorting and Graphing- Herbivores, Omnivores & Carnivores
Combine Science and Maths with this graphing activity!Learn which category each animal falls unders (herbivore, omnivore or carnivore) and display your findings using tally marks and a bar graph. Then make 2 correct statements about what you graph is showing. A PowerPoint is included for the teacher to use and create more class discussion.
Subjects:
Grades:
K - 3rd
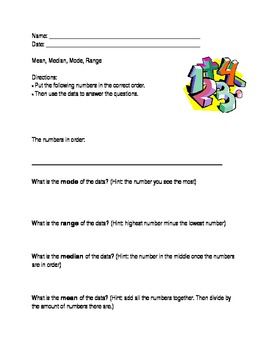
Mean, Median, Mode, Range; Modified Special Ed Math Template; Statistics
This is a modified worksheet from the middle school statistics curriculum. It is excellent for special education students who require an alternate or modified curriculum.
This worksheet allows teachers to input numbers in the blank space. This way teachers can use the template over and over with different numbers. Students are then to write the numbers in the correct order. Then, they have to find the mean, median, range, and mode. There are "hints" (formulas) that help the students differentia
Grades:
PreK - 12th
Types:

Data Representation Powerpoint
The presentation contains: 1) TALLY MARKS Learning Objectives. Definition of a tally mark. Uses of tally mark. How to count a tally mark. Tally Mark Chart. Construction of a tally mark table with an example. Application on real life problems on tally mark. Read and Interpret a tally mark table.The presentation contains: 2) FREQUENCY DISTRIBUTION TABLEDefinition of a Frequency Distribution Table. Types of Frequency Distribution Table: a) Discrete Frequency Distribution Table (Ungrouped).b) C
Subjects:
Grades:
1st - 10th, Higher Education, Staff
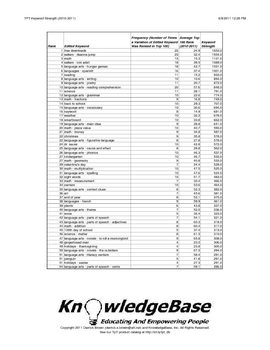
TPT KeyWord Strength Index (2010-2011) - Downloadable PDF!
What are the strongest keywords on TpT?
1. free downloads
2. Deanna Jump
3. math
Neither #1 nor #2 are surprises, but #3 (math) was certainly a surprise to me!
This report analyzes TpT's 2010-2011 keywords using a measure called "keyword strength".
The measure is based on a keyword's average rank, as well as the number of times it appeared in the 2010-2011 "Top 100" TpT search engine rankings.
This can be a valuable tool to help sellers understand TpT's marketplace supply and demand!
The P
Subjects:
Grades:
PreK - 12th, Higher Education, Adult Education, Staff
Showing 1-24 of 161 results


