5 results
Earth sciences Common Core 4.MD.B.4 activities

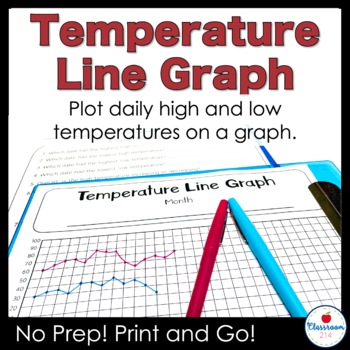
Weather Temperature Graph with Data Analysis Questions
Graph daily high and low temperatures on a line graph. At the end of the month, use the data analysis questions to promote critical thinking about temperature trends and practice graph reading skills. A perfect a weather unit, bell ringer or morning work assignment to sharpen math, earth science, and data analysis skills. WHAT'S INCLUDEDFahrenheit graph (-20 - 100 degrees Fahrenheit)Celsius graph (-20 - 40 degrees Celsius)Seven data analysis questions to be completed at the end of the monthAD
Subjects:
Grades:
2nd - 8th
Types:
NGSS:
3-ESS2-1
, MS-ESS2-5

Sunrise and Sunset Photoperiod Graph Track Amount of Daylight
Collect weekly data on the sunrise and sunset times and create a bar graph with the average monthly photoperiod information. Includes a one-page description of why the amount sunlight changes and how it is connect to the seasons.This No Prep! Print and Go! activity takes just minutes each day and targets so many key science and math skills! Use the one-page description of why seasons and daylight change to fix a common misconception about what causes Earth's seasons and the changes in the am
Subjects:
Grades:
3rd - 8th
Types:
CCSS:
NGSS:
MS-ESS2-6

Compare Precipitation Between Tropical Rain Forests and Your Home State
This math activity can be used as a stand-alone assignment or included in a thematic unit study on Tropical Rainforests.The download contains three worksheets:1) A prepared chart for students to add precipitation data (rounded to the nearest 1⁄2 inch) for their home state. This information can be provided by the teacher/parent or students can look it up themselves at weatherbase.com. The data for Costa Rica is provided for you.2) A line graph to plot the data points for the students’ home state.
Subjects:
Grades:
3rd - 5th
Types:
CCSS:

Graphing Wind Speeds
Digital activity to practice graphing coordinates with a science connection OR to learn about wind speeds with a math connection! Can be used as a print activity or virtual
Subjects:
Grades:
5th - 8th
Types:
CCSS:
NGSS:
MS-ESS2-6
, MS-ESS2-5

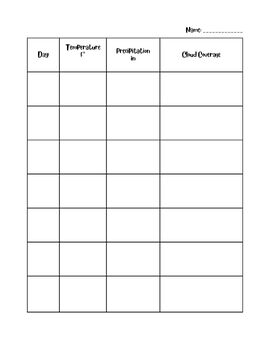
Weather Tracking Worksheet | 15 Days
15 Days of Weather Tracking for StudentsExtension questions at the end with math connections!Graphing included
Subjects:
Grades:
3rd - 6th
Types:
NGSS:
4-ESS3-1
Showing 1-5 of 5 results


