7 results
Common Core HSS-ID.A.1 activities for Easel Activities
Box and Whisker Plots Worksheet
Hello Math Teachers! Are you looking for a fun and engaging way to teach your students about Box and Whisker Plots? Our baseball-themed worksheet is perfect for middle school and algebra classes, as well as any statistics unit.This comprehensive worksheet includes both single and double box plots, and is designed to help students progress from interpreting box plots with quartiles, interquartile range, range, and median to constructing their own box plots. The two-sided worksheet comes with an e
Subjects:
Grades:
7th - 8th
Types:
CCSS:
Also included in: Data and Statistics Worksheets Bundle
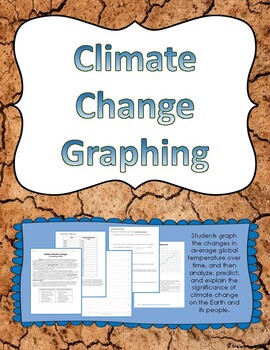
Climate Change Graphing Activity
Students graph the changes in average global temperature over time, and then analyze, predict, and explain the significance of climate change on the Earth and its people.Students read info related to climate change, then create a graph of average global temperature changes over the past 140 years. Students are then to answer several analysis questions, which could also be used to drive a meaningful classroom discussion about climate change.Included is a teacher's key which shows what the resulti
Subjects:
Grades:
5th - 11th
Types:
CCSS:
Histograms Interpreting and Creating Worksheet
Hey Math Teachers! This Histograms Worksheet is the perfect resource to help your students master constructing and interpreting histograms. This two-sided Math worksheet includes progressively challenging problems on displaying numerical data using histograms and questions on interpreting histograms. We provide scaffolding to help your students identify the components of a set of data, assess the skew of data, and report the number of observations.This worksheet is suitable for Middle School Mat
Subjects:
Grades:
6th - 9th
Types:
CCSS:
Also included in: Data and Statistics Worksheets Bundle
Stem and Leaf Plot Worksheet
Attention, Math Heroes! Are you ready to unleash your inner superhero and conquer stem and leaf plots like never before? Look no further! Our action-packed comic book movie themed worksheet is here to save the day and take your statistics lesson to new heights! Why Choose Our Stem and Leaf Math Worksheet? Engaging Comic Book Theme: Step into the world of superheroes with our dynamic comic book theme! From daring superheroes to epic villains, students will embark on an exciting math adventure as
Subjects:
Grades:
9th
Types:
CCSS:
Also included in: Data and Statistics Worksheets Bundle
Circle Graphs Interpreting Data Worksheet
Attention Math Teachers! This Circle Graphs Worksheet is the ultimate resource to help your students become proficient in constructing and interpreting circle graphs. This comprehensive two-sided Math worksheet is suitable for Middle School Math through Algebra 1 classes and includes progressively challenging problems that will help your students master circle graphs.This Circle Graphs Worksheet is perfect for use as a homework assignment or a classwork activity, and we've included an easy-to-us
Subjects:
Grades:
7th
Types:
CCSS:
Also included in: Data and Statistics Worksheets Bundle
Sampling Distributions Activity AP Statistics
Introduce students to sampling distributions with this inquiry activity. Students This is appropriate before formal notes to Sampling distributions in an AP Statistics Curriculum.Included in this resource:*3 part inquiry activityAnswer keyTeacher directionsTopics included:Sampling distributionsThis resource can be found in the following bundles:AP Statistics CurriculumAP Statistics Unit 3*NOTE: this activity requires 30 m&ms, beans or other colored markers per group (2-3 students)Get studen
Subjects:
Grades:
9th - 12th
Types:
CCSS:
Mean, Median, Mode, and Visualizing Real Data - Group Activities
These activities and handouts task groups of students to calculate the mean, median, mode, and range of real data, as well as plotting a box plot and a histogram, through 6 group activities that can take 1 to 3 hours, depending on the class. Solutions are provided where applicable (3 activities).Target Level of Math Class:Pre-algebra, arithmetic, introduction to statistics, data visualizationAccess to calculators.For completion in groups in person, with students actively sharing solutions with
Subjects:
Grades:
Not Grade Specific
Types:
Showing 1-7 of 7 results

