Walking Dead Lab (An Exploration of Speed, Velocity & Acceleration)
- PDF
- Easel Activity
What educators are saying
Also included in
- This custom bundle includes the 19 products listed above at a 25% discount.CONNECT WITH ME ON THESE SOCIAL MEDIA PLATFORMS:InstagramFacebookPinterest©2020 Science Teaching Junkie, Inc. Terms of Use - this resource is for use by one teacher only. Additional teachers must purchase their own license.Price $68.93Original Price $91.90Save $22.97
- This custom bundle includes the 81 products listed above at a 25% discount.Price $312.86Original Price $417.15Save $104.29
Description
Now you can add an interactive layer to this PDF and assign it to your students through Google Classroom!
Use this exciting lab to help students discover speed, velocity and acceleration and how various motions are represented graphically. This product includes almost everything you will need for this lab with the exception of measuring tape, timing device, and metal washers (or other similar weights).
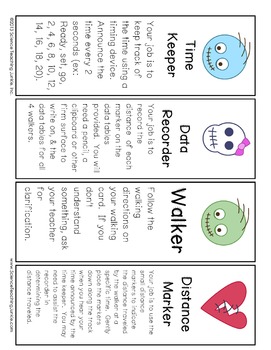
Before the lab, students are assigned a task (job cards are included) and 4 different "walkers" are given specific walking jobs (walking cards included).
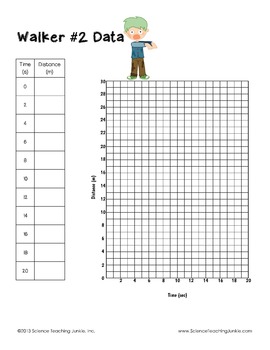
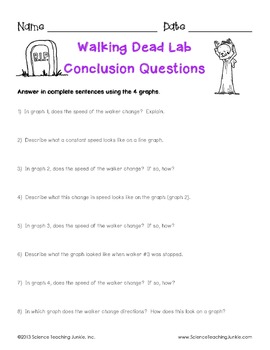
As each walker walks, a time keeper calls out the time every 2 seconds. Distance markers are placed along the walking track every 2 seconds and data is recorded. After data has been collected on all 4 walkers, students create line graphs using the data. Students are able to see visual representations of their classmates' motions on the graphs. Students will see the following motions represented graphically: constant speed, acceleration, low speed, high speed, stopped (no motion), and returning to start.
Students love it and you will love the test scores that show your students mastering the concepts!
CONNECT WITH ME ON THESE SOCIAL MEDIA PLATFORMS:
©2012 Science Teaching Junkie, Inc. Terms of Use - this resource is for use by one teacher only. Additional teachers must purchase their own license. If you are interested in purchasing several licenses, please contact me for a district-wide or campus-wide quote. This product should NOT be posted on any website. ScienceTeachingJunkie@yahoo.com


