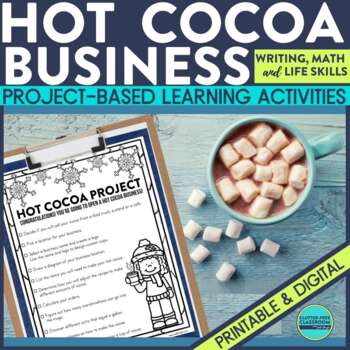
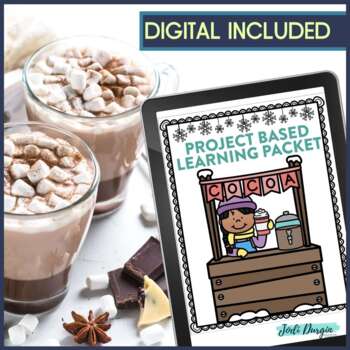
WINTER MATH PROJECT BASED LEARNING How to Make Hot Chocolate COCOA STAND Writing

What educators are saying
Description
Your students will LOVE creating their own Hot Cocoa Business as they work through these engaging Winter Math and Writing Project Based Learning Activities. What a fun way for 2nd, 3rd or 4th grade students to practice their math and writing skills in a creative way!
The students take on the role of bakery owners selling Valentine's Day Cookies. Throughout the project they will:
- double, triple and halve recipes (working with fractions)
- taking orders and making change (working with money)
- create a schedule for baking the cookies (telling time and elapsed time)
- divide to fill cups with marshmallows
- convert liquid measurement units
- compose process writing explaining how to decorate cookies
- write descriptive paragraphs
- create a bar graph and analyze data
Use the resource as:
◼️ PBL task
◼️ math project
◼️ math centers
◼️ enrichment activities
◼️ fast finisher activities
◼️ homework
◼️ sub plans activities
WHAT IS INCLUDED
Please see all that is included by looking at the preview.
✔ project cover so you can present the PBL task as a packet
✔ student directions that come in the form of a checklist to guide students through completing the project
✔ writing activities that are highly engaging for students
✔ math activities that invite students to apply math skills to a real world situation
✔ digital version so students can access it from home or on a computer
✔ answer keys to make grading quick and easy
5 REASONS TEACHERS LOVE THIS PBL TASK
► The activities require no prep – just print and go!
► Students love these types of activities and will be highly engaged when working on them.
► This can serve as an ongoing project, which helps students build stamina and give you a filler or fast finisher task, so you’ll be covered in a pinch.
► There are tons of activities included in this packet, so you can pick and choose which ones work best for you and your students.
► Many of the activities are open-ended so they can be used across grade levels, which means you can continue to use them even if you switch grade levels in the future. Several of the pages also include a blank version that you can write on to create differentiated versions to modify for your students' individual needs.
VISIT OUR LET'S GET CONNECTED PAGE TO LINK TO . . .
◼️ THE EMAIL CLUB → weekly freebies
◼️ FACEBOOK GROUP → a supportive community of elementary teachers
◼️ THE TPT STORE → new resources 50% off
◼️ THE BLOG → teaching tips and ideas
◼️ INSTAGRAM → a look behind the scenes


