Using Percents and Proportions to Teach Electoral College (ANSWERS)
- Word Document File
- Excel Spreadsheets
Description
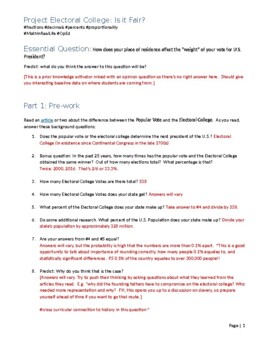
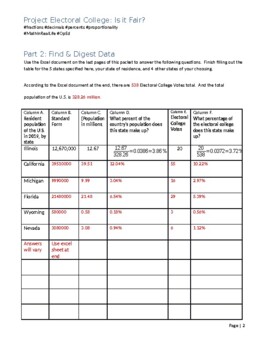
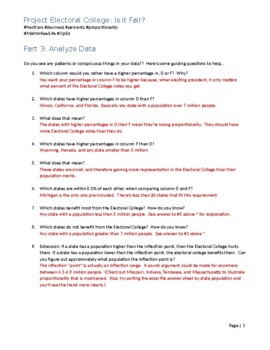
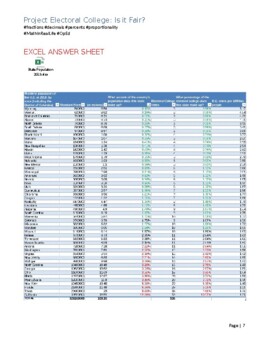
These are the answers to the project posted here. There's an embedded excel file with a sortable table with all the percentages. I typed in lots of tips for extending the project and enriching discussion e.g. per capita calculations, the origins of the electoral college, an article link, etc.
Project description:
The question that will loom over the course of students' lifetimes: What should we do with the Electoral College? To construct a position on this question, students must objectively digest and analyze data to reveal proportionality.
In this inquiry-based project, which can be done in class or self paced, students will practice converting fractions into decimals into percents. They will then compare and contrast percentages to determine if proportionality is maintained when scaling the general population down to Electoral College votes.
By the end of the project, students have an opportunity to write an OpEd piece wrapping their mathematical findings into a compelling argument.
Cross curricular connection! Complete this project which History/Government department is covering the Electoral College.
Original project (student ready) found in my store here.


