US Gross Domestic Product (GDP) Infographics Analysis Lesson
- Word Document File
What educators are saying
Description
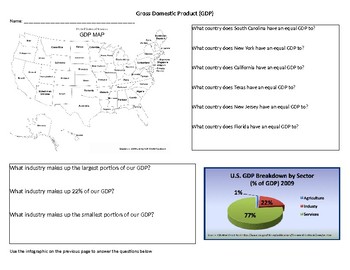
Teach your students about the US Gross Domestic Product (GDP) through analyzing various infographics with this engaging lesson plan. This activity provides a comprehensive overview of GDP and includes:
- Observation and comparison of US GDP to other countries
- Analysis of changes in US GDP over time
- Identification of the types of spending that make up US GDP
- And more!
This lesson is perfect for promoting critical thinking and data analysis skills. Help your students understand the significance of GDP and its impact on the US economy.
*Note: All questions should be able to be answered without colored infographics (we do not have color printers at my school). I post a copy of the infographics on Schoology so that students can reference the color versions if needed.
Tags: GDP, US GDP, gross domestic product, infographics, economic indicators, data analysis, comparative analysis, national economy, fiscal policy, macroeconomics, social studies


