TPT
Total:
$0.00

Trigonometry Graphing Activity Bundle

Rated 5 out of 5, based on 1 reviews
5.0 (1 rating)
;
Newton's Solutions
108 Followers
Grade Levels
9th - 12th
Resource Type
Standards
Formats Included
  • Google Drive™ folder
  • Internet Activities
$18.00
List Price:
$27.00
You Save:
$9.00
Bundle
$18.00
List Price:
$27.00
You Save:
$9.00
Bundle
Share this resource
Report this resource to TPT
Newton's Solutions
108 Followers
Includes Google Apps™
This bundle contains one or more resources with Google apps (e.g. docs, slides, etc.).
Easel Activities Included
Some resources in this bundle include ready-to-use interactive activities that students can complete on any device.  Easel by TPT is free to use! Learn more.

What educators are saying

My students enjoyed working with the activities. It provided much-needed practice without is being straight problem after problem.

Products in this Bundle (10)

    showing 1-5 of 10 products

    Description

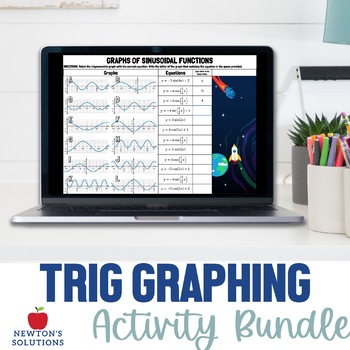
    Trigonometric Graphs Activity Bundle

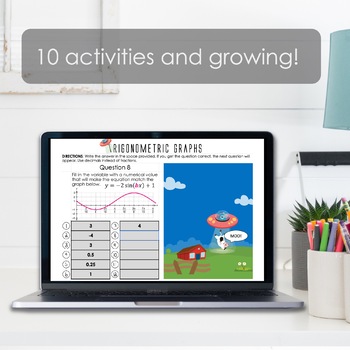
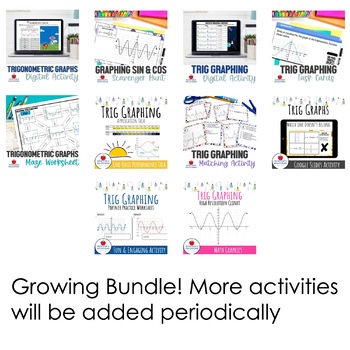
    This bundle contains the following activities to use during a trig graphing unit. This is a growing bundle and activities will be periodically added. You will be notified when a new product is added to the bundle.

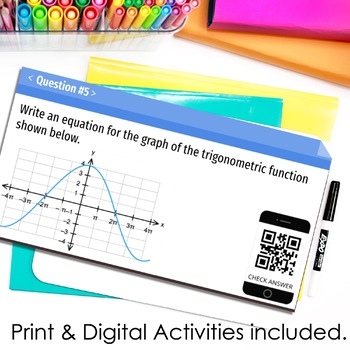
    1) Graphs of Trigonometric Functions Task Cards

    2) Trig Graphing Application Task Project

    3) Trig Graphing Maze

    4) Trigonometry Graphing Scavenger Hunt

    5) Trigonometry Graphing: Which One Doesn't Belong

    6) Trigonometry Graphs Matching Activity

    7) Trigonometry Graphs Math Clipart

    8) Trigonometry Graphing Partner Practice Worksheet

    9) Graphs of Trig Functions Digital Activity

    10) Trigonometric Graphs Matching Digital Activity

    ___________________________________________________________________

    LICENSING TERMS: This purchase includes a single license that may only be assigned to a single specific individual user. Individual licenses are non-transferable and may not be used by or reallocated to a different teacher.   No part of this resource is to be shared with colleagues or used by an entire grade level, school, or district without purchasing the proper number of licenses.

    COPYRIGHT TERMS: This resource may not be uploaded to the internet in any form, including classroom/personal websites or network drives, unless the site is password protected and can only be accessed by students.

    Total Pages
    Answer Key
    Included
    Teaching Duration
    N/A
    Report this resource to TPT
    Reported resources will be reviewed by our team. Report this resource to let us know if this resource violates TPT’s content guidelines.

    Standards

    to see state-specific standards (only available in the US).
    For a function that models a relationship between two quantities, interpret key features of graphs and tables in terms of the quantities, and sketch graphs showing key features given a verbal description of the relationship.
    Graph functions expressed symbolically and show key features of the graph, by hand in simple cases and using technology for more complicated cases.
    Graph exponential and logarithmic functions, showing intercepts and end behavior, and trigonometric functions, showing period, midline, and amplitude.
    Choose trigonometric functions to model periodic phenomena with specified amplitude, frequency, and midline.

    Reviews

    Questions & Answers

    108 Followers