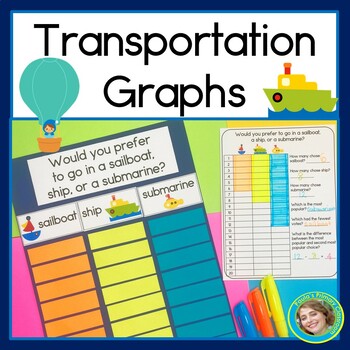
Transportation Graphing | Making and Interpreting Picture and Bar Graphs
Paula's Primary Classroom
5k Followers
Grade Levels
PreK - 2nd, Homeschool
Subjects
Resource Type
Standards
CCSSK.CC.A.3
CCSSK.CC.B.4
CCSSK.CC.B.5
CCSS1.MD.C.4
CCSS2.MD.D.10
Formats Included
- PDF
Pages
18 pages
Paula's Primary Classroom
5k Followers
Also included in
- This Transportation Bundle includes 6 great resources to get your students reading, writing, graphing, doing hundreds charts, subtracting, measuring and sorting. Updated April 2021 to include digital math activities, so you can use it for in class or remote learning, centers, morning work, whole clPrice $13.20Original Price $18.90Save $5.70
- This school year your students will focus on math when they're asked to share their ideas and opinions! Harness student excitement and focus it on graphing and math with 78 horizontal, vertical and picture graphs in 2 formats: as single pages to project and complete as a group & as headers to usPrice $20.95Original Price $29.85Save $8.90
Description
Transportation graphs are a fun way to incorporate math learning into the popular transportation theme. There are 7 graphs, including vertical, horizontal and pictographs, and each is offered as both a projectable single page graph (with follow up questions included!) and as headers for a pocket chart or poster graph. Practice graphing with airplanes, submarines, cars, hot air balloons, trucks, fire engines, rocket ships, boats, buses, police cars, sleds, ice skates, taxis, snowboards, skis and ambulances - there is something to appeal to every student!
Click here to be notified when new resources are released at 50% off!
For more Transportation theme fun see:
- Transportation Hundreds Charts,
- Sight Word Mystery Pictures: Transportation,
- Transportation Math and
- Transportation Bundle .
Thank you for visiting Paula's Primary Classroom!
- Join my email list & get freebies!
- Follow me on FaceBook.
- Follow me on Instagram.
- Follow me on Pinterest.
Have a great day!
♥ Paula
Total Pages
18 pages
Answer Key
N/A
Teaching Duration
1 Week
Last updated Oct 16th, 2022
Report this resource to TPT
Reported resources will be reviewed by our team. Report this resource to let us know if this resource violates TPT’s content guidelines.
Standards
to see state-specific standards (only available in the US).
CCSSK.CC.A.3
Write numbers from 0 to 20. Represent a number of objects with a written numeral 0-20 (with 0 representing a count of no objects).
CCSSK.CC.B.4
Understand the relationship between numbers and quantities; connect counting to cardinality.
CCSSK.CC.B.5
Count to answer “how many?” questions about as many as 20 things arranged in a line, a rectangular array, or a circle, or as many as 10 things in a scattered configuration; given a number from 1-20, count out that many objects.
CCSS1.MD.C.4
Organize, represent, and interpret data with up to three categories; ask and answer questions about the total number of data points, how many in each category, and how many more or less are in one category than in another.
CCSS2.MD.D.10
Draw a picture graph and a bar graph (with single-unit scale) to represent a data set with up to four categories. Solve simple put-together, take-apart, and compare problems using information presented in a bar graph.


