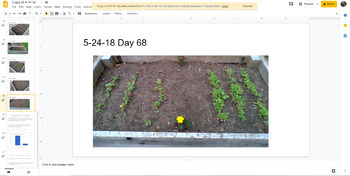
To Thin or Not to Thin Experiment
- Zip
- Google Apps™

Description
In these lessons students will design and conduct an experiment to determine how thinning crops affect the yield. Students are split into groups which each are measuring a different variable about the radishes. There are 4 "lessons", but the data collection day is repeated at least 6 times, and is only one day a week. Each lesson has detailed lesson plans, list of materials, and examples of work from students.
These lessons some of the best to get students to think like scientists. They were designed around NGSS standard:
MS-LS1-5
Construct a scientific explanation based on evidence for how environmental
and genetic factors influence the growth of organisms.
That being said students also engage in the NGSS scientific practices: Asking Questions, Planning and Carrying Out Investigations, Using Mathematical and Computational Thinking, Constructing Explanations, and Engaging in Argument from Evidence.
These lessons were designed in Google Drive, but unfortunately I would need to put everything in one Drive folder(TpT can't make copies of folders in folders), which is a lot of documents. I decided to instead keep the files divided into the subfolders: Examples of Student Work, Resources, and Lesson Plans. This does mean it needs to be shared as a zip folder.


