TPT
Total:
$0.00

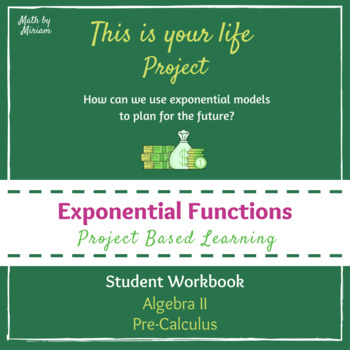
This is your life Project Workbook (Exponentials PBL Project)

;
Math by Miriam
30 Followers
Grade Levels
9th - 12th, Higher Education
Standards
Formats Included
  • PDF
Pages
13 pages
$9.99
$9.99
Share this resource
Report this resource to TPT
Math by Miriam
30 Followers

Description

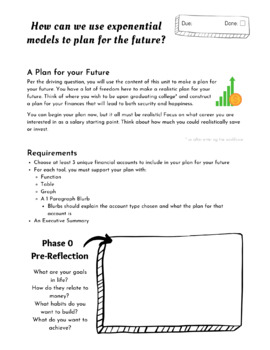
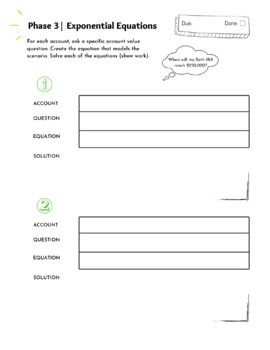
Help students explore exponential growth with a financial & life planning project. This student workbook will guide students in making a preliminary plan for their future where money is concerned. There are step by step directions, examples, and reflection questions embedded in this journey. This is a project guide only; you still need to teach students the content about exponential functions and solving equations throughout the project.

I facilitated this project using the workbook for the first time last year and it was amazingly helpful for students working at a different rate than the timeline I set.

I strongly recommend you plan a presentation day when you invite parents and community partners to see students' work! During COVID-19 restrictions, consider setting up an online event where students can show videos of their presentations to outside adult connections. Allowing students to showcase their work is a great motivator and a great way to assess their understanding of the material.

Inviting a financial adviser to present to your students at the start of the project is a great entry event.

Total Pages
13 pages
Answer Key
N/A
Teaching Duration
1 month
Report this resource to TPT
Reported resources will be reviewed by our team. Report this resource to let us know if this resource violates TPT’s content guidelines.

Standards

to see state-specific standards (only available in the US).
Interpret complicated expressions by viewing one or more of their parts as a single entity. For example, interpret 𝘗(1 + 𝘳)ⁿ as the product of 𝘗 and a factor not depending on 𝘗.
Create equations in two or more variables to represent relationships between quantities; graph equations on coordinate axes with labels and scales.
For a function that models a relationship between two quantities, interpret key features of graphs and tables in terms of the quantities, and sketch graphs showing key features given a verbal description of the relationship.
Graph exponential and logarithmic functions, showing intercepts and end behavior, and trigonometric functions, showing period, midline, and amplitude.
Write a function that describes a relationship between two quantities.

Reviews

Questions & Answers

30 Followers