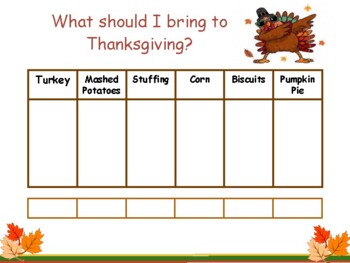
Thanksgiving Bar Graph
Ms Gural's Worksheets
1 Follower
Grade Levels
1st - 8th
Subjects
Resource Type
Standards
CCSS3.MD.B.3
CCSS3.MD.B.4
Formats Included
- PDF
Pages
2 pages
Ms Gural's Worksheets
1 Follower
Description
Have students complete with the whole class or work in small groups. This is a great resource to use around Thanksgiving to have students practice making bar graphs!
Total Pages
2 pages
Answer Key
Does not apply
Teaching Duration
N/A
Report this resource to TPT
Reported resources will be reviewed by our team. Report this resource to let us know if this resource violates TPT’s content guidelines.
Standards
to see state-specific standards (only available in the US).
CCSS3.MD.B.3
Draw a scaled picture graph and a scaled bar graph to represent a data set with several categories. Solve one- and two-step “how many more” and “how many less” problems using information presented in scaled bar graphs. For example, draw a bar graph in which each square in the bar graph might represent 5 pets.
CCSS3.MD.B.4
Generate measurement data by measuring lengths using rulers marked with halves and fourths of an inch. Show the data by making a line plot, where the horizontal scale is marked off in appropriate units-whole numbers, halves, or quarters.


