TPT
Total:
$0.00

Statistics Test with Study Guide

Rated 5 out of 5, based on 8 reviews
5.0 (8 ratings)
;
Grade Levels
8th - 10th, Homeschool
Resource Type
Standards
Formats Included
  • Zip
Pages
9 + answer keys
$5.00
$5.00
Share this resource
Report this resource to TPT

What educators are saying

I loved this resource and bought others that go with it. Highly recommend this if you used the other resources.
Love these guided notes. They are very similar to notes that I prepared myself but better organized. Lots of good examples and extra examples. Thank you!
Also included in
  1. This is a complete statistics unit for an Algebra 1 course. All assessments (quizzes, study guide, and test) are editable to fit your needs. This unit is included in my Algebra 1 Curriculum.*Note: This unit is best suited for on-level or lower-level/special education math classes. Supplements will m
    Price $49.00Original Price $49.00

Description

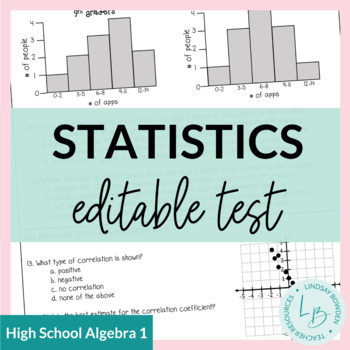
This resource includes a statistics unit test and study guide for an Algebra 1 statistics unit.

The editable versions are PowerPoints where you can edit text as needed.

Topics covered:

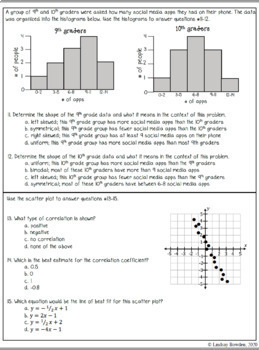
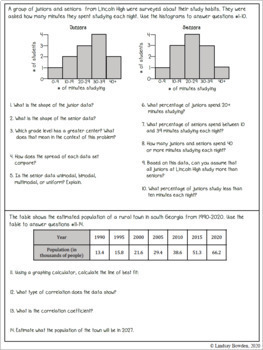
  • Histograms, Dot Plots, Box and Whisker Plots
  • Range, Interquartile Range
  • Mean Absolute Deviation
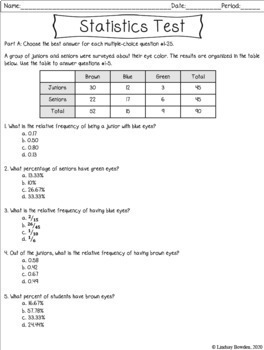
  • Two-Way Frequency Tables
  • Scatter Plots and Correlation
  • Line of Best Fit

There are 20 multiple choice questions and 10 free response questions. Test and answer documents are divided so that if you only wanted to give the multiple choice section, you have that option.

Answer key and student answer sheet included!

This assessment pairs great with my:

Terms of Use:

This product should only be used by the teacher who purchased it. This product is not to be shared with other teachers. Please buy the correct number of licenses if this is to be used by more than one teacher.

Did you know?

You can receive TPT store credits to use on future purchases by leaving feedback on products you buy! Just click on "My Purchases" under "Buy"!


Connect with me!

Blog

Instagram

Facebook

Pinterest

Total Pages
9 + answer keys
Answer Key
Included
Teaching Duration
N/A
Report this resource to TPT
Reported resources will be reviewed by our team. Report this resource to let us know if this resource violates TPT’s content guidelines.

Standards

to see state-specific standards (only available in the US).
Represent data with plots on the real number line (dot plots, histograms, and box plots).
Use statistics appropriate to the shape of the data distribution to compare center (median, mean) and spread (interquartile range, standard deviation) of two or more different data sets.
Interpret differences in shape, center, and spread in the context of the data sets, accounting for possible effects of extreme data points (outliers).
Use the mean and standard deviation of a data set to fit it to a normal distribution and to estimate population percentages. Recognize that there are data sets for which such a procedure is not appropriate. Use calculators, spreadsheets, and tables to estimate areas under the normal curve.
Summarize categorical data for two categories in two-way frequency tables. Interpret relative frequencies in the context of the data (including joint, marginal, and conditional relative frequencies). Recognize possible associations and trends in the data.

Reviews

Questions & Answers