Statistics Project: Designing a Linear Regression Analysis (High School)
Math with Ms Li
6 Followers
Grade Levels
9th - 12th, Higher Education
Subjects
Resource Type
Standards
CCSSHSS-ID.A.1
CCSSHSS-ID.A.2
CCSSHSS-ID.A.3
CCSSHSS-ID.A.4
CCSSHSS-ID.B.5
Formats Included
- Word Document File
Math with Ms Li
6 Followers
Also included in
- Hi!This bundle includes the full lesson for two-variable data and activities to supplement the lesson. It also includes a full project and a graphic organizer for students to use throughout the chapter to supplement their learning on scatter plots, regression lines, and correlation. Please see eachPrice $17.00Original Price $19.50Save $2.50
- This bundle compiles projects for AP Statistics and High School Statistics Projects. If you're looking for more detailed descriptions of each project, check out my shop! The projects cover data collection, normal distributions, regression analysis, inference procedures, and more.Price $25.00Original Price $28.00Save $3.00
Description
Updated as of 5/28 with graphic organizers and sentence starters.
Hello!
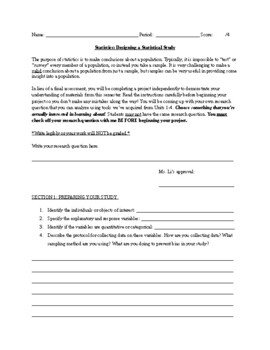
I've designed a statistics project that students in my class loved! This project requires students to collect data on a topic that interests them. They have to design a sampling method that is as unbiased as possible. Students are then required to analyze their data and summary statistics. They also need to do a regression analysis on their study and make inferences using their results. This is perfect for a replacement of a test or as an end-of-semester project for students. Perfect for high school students! If you teach with Stats Medic, this assignment is aligned to StatsMedic content and wraps up Unit 3 (collecting data) nicely.
Total Pages
Answer Key
N/A
Teaching Duration
1 Week
Last updated 2 weeks ago
Report this resource to TPT
Reported resources will be reviewed by our team. Report this resource to let us know if this resource violates TPT’s content guidelines.
Standards
to see state-specific standards (only available in the US).
CCSSHSS-ID.A.1
Represent data with plots on the real number line (dot plots, histograms, and box plots).
CCSSHSS-ID.A.2
Use statistics appropriate to the shape of the data distribution to compare center (median, mean) and spread (interquartile range, standard deviation) of two or more different data sets.
CCSSHSS-ID.A.3
Interpret differences in shape, center, and spread in the context of the data sets, accounting for possible effects of extreme data points (outliers).
CCSSHSS-ID.A.4
Use the mean and standard deviation of a data set to fit it to a normal distribution and to estimate population percentages. Recognize that there are data sets for which such a procedure is not appropriate. Use calculators, spreadsheets, and tables to estimate areas under the normal curve.
CCSSHSS-ID.B.5
Summarize categorical data for two categories in two-way frequency tables. Interpret relative frequencies in the context of the data (including joint, marginal, and conditional relative frequencies). Recognize possible associations and trends in the data.


