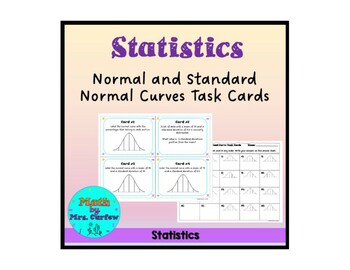
Statistics - Normal Distribution and Curves Task Cards
Math by Mrs Curfew
151 Followers
Grade Levels
10th - 12th, Higher Education
Subjects
Resource Type
Standards
CCSSHSS-MD.A.1
CCSSHSS-MD.A.2
CCSSHSS-MD.A.4
CCSSHSS-MD.B.7
Formats Included
- PDF
Pages
6 pages
Math by Mrs Curfew
151 Followers
What educators are saying
I actually will be prepping it for review later on in the school year. Had I remembered I downloaded it, I would have used these cards rather than straight mc questions for extra practice! I will definitely be using it later in the year or next school year!!
Also included in
- This is a bundle of all of the activities I have made for my Statistics classes (so far). As I create more, this bundle will be updated.Price $27.00Original Price $30.00Save $3.00
Description
Do you need your student to get more practice creating normal distributions, normal curves, using the empirical rule, working with a bell curve, calculating the z score of a normal distribution, and finding the area/probability of a region under the curve between certain values? I know my students did, so this is what I created for them!
There are 20 task cards in this set practicing just those types of problems. There is an answer sheet with blank normal curve graphs on them so they can work through each prompt. Answer key is also included.
Total Pages
6 pages
Answer Key
Included
Teaching Duration
1 hour
Last updated Jan 31st, 2023
Report this resource to TPT
Reported resources will be reviewed by our team. Report this resource to let us know if this resource violates TPT’s content guidelines.
Standards
to see state-specific standards (only available in the US).
CCSSHSS-MD.A.1
Define a random variable for a quantity of interest by assigning a numerical value to each event in a sample space; graph the corresponding probability distribution using the same graphical displays as for data distributions.
CCSSHSS-MD.A.2
Calculate the expected value of a random variable; interpret it as the mean of the probability distribution.
CCSSHSS-MD.A.4
Develop a probability distribution for a random variable defined for a sample space in which probabilities are assigned empirically; find the expected value. For example, find a current data distribution on the number of TV sets per household in the United States, and calculate the expected number of sets per household. How many TV sets would you expect to find in 100 randomly selected households?
CCSSHSS-MD.B.7
Analyze decisions and strategies using probability concepts (e.g., product testing, medical testing, pulling a hockey goalie at the end of a game).


