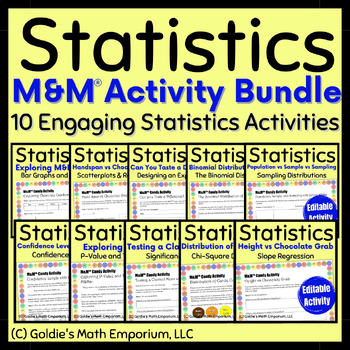
Statistics Chocolate Candy Activity Bundle
- Zip
What educators are saying
Products in this Bundle (10)
showing 1-5 of 10 products
Description
Statistics Chocolate Candy Activity Bundle
This bundle contains 10 activities that involve using M&M™ candies to understand, practice, and reinforce concepts throughout your statistics course.
These activities can be used with your AP Statistics or regular level statistics class. Here are the following activities:
- Exploring M&M Colors (Bar Graph and Dotplots)
- Handspan vs Chocolate Grab (Scatterplots and Regression)
- Can You Taste a Difference? (Experimental Design)
- Binomial Distribution of Blue (The Binomial Distribution)
- Population, Sample, and Sampling with Yellow (Sampling Distributions)
- Confidence Levels with Yellow (Confidence Intervals)
- Exploring P-Value and Type I Error (Significance Test for Proportions)
- Testing a Claimed Mean (Significance Test for Means)
- Distribution of Colors (Chi-Square Distribution)
- Height vs Chocolate Grab (Inference for Slope)
Each activity is a ZIP folder with the following:
- A Word document of the activity (both color and pure black and white)
- A PDF document of the activity (both color and pure black and white)
- A PDF answer key with sample data
- A PDF instruction page
Click on each individual product to see a preview of the activity.
***************************************************************************************
This series of activities is included in the following products as well. If you have any of the following, these 10 activities are now in the updated product:
Goldie's FULL CURRICULUM for AP® Statistics
AP® Statistics Projects and Activities Bundle
***************************************************************************************
If you need extra explanations or additional guidance, I would love to help!! Contact me at goldiesmathemporium[at]gmail.com for any questions or samples.
AP® is a registered trademark of the College Board® which does not endorse this product.
I want to provide the best possible resources to help other teachers out! You will be notified of any future updates and additions to this product and it will be free of charge. Your support is important and I thank you for allowing me to continue doing what I love to do.
© Goldie’s Math Emporium, LLC
This work is bound by copyright laws and editing (beyond your own classroom use), selling, redistributing, or posting all or part of these documents on the Internet is strictly prohibited. Violations are subject to the Digital Millennium Copyright Act.


