Virginia Roney
79 Followers
Description
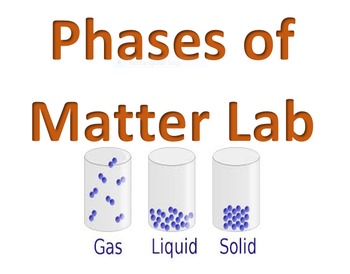
This lab is relatively simple. Students investigate the relationship between states of matter and temperature. Students simply see what happens to the temperature of a substance as you melt ice. Many students think it will be a steady increase and do not realize there will be flat parts to the graph.
By the end of the lab students graph will graph the data they collected. If students have collected data carefully, then it should look like a phase change diagram. To spruce things up in the lab you can provide hot chocolate packets and they can have themselves some hot chocolate at the end.
**Also if you have access to vernier probe equipment, this is a GREAT lab to use it on and I would highly recommend using their temperature probe instead of recording temperature with a thermometer.
**Please spend time to rate this product so I can know if it is working for you. I want to make sure my products are as helpful as possible.
http://www.teacherspayteachers.com/Product/States-of-Matter-and-Phase-Change-Diagram-Lab-1523616
Total Pages
2 pages
Answer Key
N/A
Teaching Duration
1 hour
Report this resource to TPT
Reported resources will be reviewed by our team. Report this resource to let us know if this resource violates TPT’s content guidelines.


