Smartboard Lesson: Histogram Creation
Miss Middle School Teacher
740 Followers
Resource Type
Formats Included
- NOTEBOOK (SMARTboard) File
Pages
21 pages
Miss Middle School Teacher
740 Followers
Description
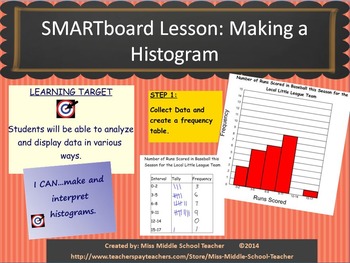
Smartboard Lesson on How to Create a Histogram by Miss Middle School Teacher
Learning Target: Students will be able to analyze and display data in various ways.
I Can: create and analyze a histogram.
This is a 21 slide lesson introducing students to graphing and graph analysis. The following components are covered in this lesson:
1) What is a histogram?
2) What is the purpose of a histogram?
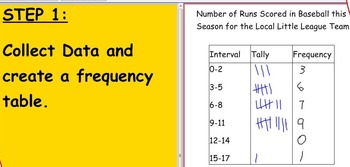
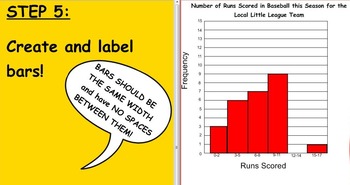
3) How do I make a histogram? (this takes students through histogram creation using a step-by-step approach with an example)
4) What conclusions can I draw from a histogram?
This would be a great lesson to create a FLIPPED video with as well!
I've also included a YouTube link to a video-recorded version of me teaching this lesson in case you want tips for how I used it with my students.
Be sure to visit my store for similar lessons on:
Bar Graphs
Line Graphs
Stem and Leaf Plots
Circle Graphs
Frequency Tables
Box and Whisker Plots
Get all 7 Lessons Bundled at a DISCOUNTED price! http://www.teacherspayteachers.com/Store/Miss-Middle-School-Teacher
Total Pages
21 pages
Answer Key
N/A
Teaching Duration
N/A
Report this resource to TPT
Reported resources will be reviewed by our team. Report this resource to let us know if this resource violates TPT’s content guidelines.


