Slope 8th Grade Math
Education with DocRunning
4.2k Followers
Resource Type
Standards
CCSS8.F.A.2
CCSS8.F.A.3
Formats Included
- Zip
- Easel Activity
Pages
60+
Education with DocRunning
4.2k Followers
Easel Activities Included
Some resources in this bundle include ready-to-use interactive activities that students can complete on any device. Easel by TPT is free to use! Learn more.
Products in this Bundle (6)
showing 1-5 of 6 products
Also included in
- Get my ENTIRE library of Algebra 1 resources. Interactive notebooks, math detectives, coded messages, paper chains, task cards, projects and more fill this Algebra 1 resource bundle There are currently over 100 resources included in this bundle. You save on the current resources in the bundle PLPrice $201.50Original Price $254.26Save $52.76
- Save more than 30% on 60 Algebra 1 activities. Activities include math detectives, quests, coded messages, task cards, puzzles, paper chains, card sorts, projects and more on 9 Algebra 1 related topics.Topics include:- ALGEBRA BASICS- EQUATIONS- INEQUALITIES- FUNCTIONS- LINEAR FUNCTIONS/EQUATIONS-Price $100.00Original Price $147.02Save $47.02
Description
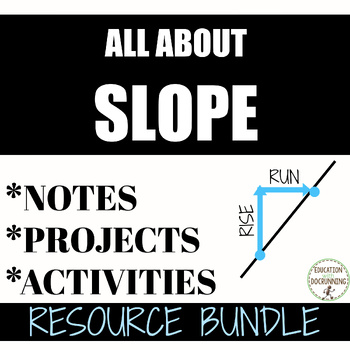
Explore slope or rate of change in your Algebra 1 or 8th grade math class with this set of 9 resources including:
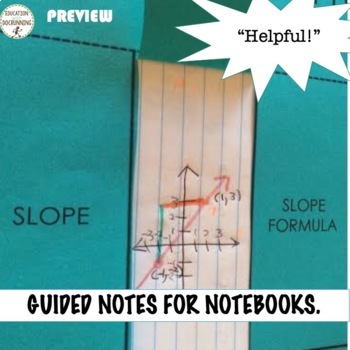
- notes
- task cards
- paper chain
- math detective
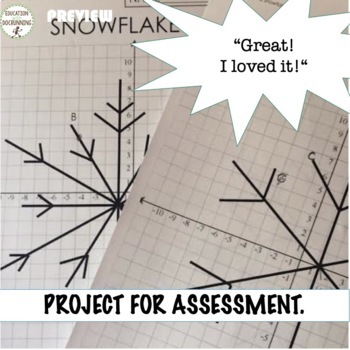
- project
A great addition to your Pre-Algebra and Algebra curriculum .
This purchase is for one teacher only. This resource is not to be shared with colleagues or used by an entire grade level, school, or district without purchasing the proper number of licenses. This resource may not be uploaded to be shared beyond your students or with colleagues. If you are interested in a site license, please contact me for a quote.
Total Pages
60+
Answer Key
Included
Teaching Duration
1 Week
Report this resource to TPT
Reported resources will be reviewed by our team. Report this resource to let us know if this resource violates TPT’s content guidelines.
Standards
to see state-specific standards (only available in the US).
CCSS8.F.A.2
Compare properties of two functions each represented in a different way (algebraically, graphically, numerically in tables, or by verbal descriptions). For example, given a linear function represented by a table of values and a linear function represented by an algebraic expression, determine which function has the greater rate of change.
CCSS8.F.A.3
Interpret the equation 𝘺 = 𝘮𝘹 + 𝘣 as defining a linear function, whose graph is a straight line; give examples of functions that are not linear. For example, the function 𝘈 = 𝑠² giving the area of a square as a function of its side length is not linear because its graph contains the points (1,1), (2,4) and (3,9), which are not on a straight line.


