Science Interpreting Data From Tables and Graphs
Julie Rhodes
60 Followers
Grade Levels
3rd - 7th
Subjects
Resource Type
Formats Included
- Word Document File
Pages
5 pages
Julie Rhodes
60 Followers
What educators are saying
This was a great way to review with my students what IOWA assessment science questions would look like.
Description
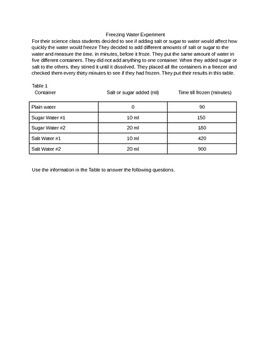
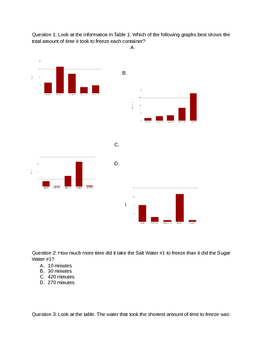
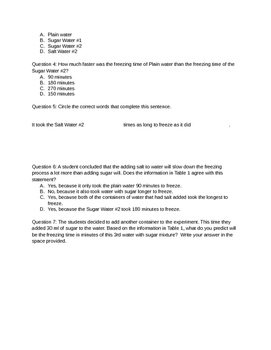
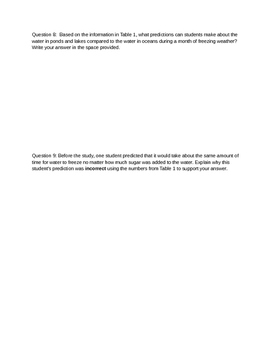
This activity was created to help students use information found in tables and graphs to answer science questions. These questions consist of multiple choice, fill in, and open ended. They must interpret and reason to figure out the answers. They questions and information are designed to help students prepare for the ACT Aspire.
Total Pages
5 pages
Answer Key
Included
Teaching Duration
N/A
Report this resource to TPT
Reported resources will be reviewed by our team. Report this resource to let us know if this resource violates TPT’s content guidelines.


