Laura Becker
1.2k Followers
Laura Becker
1.2k Followers
Description
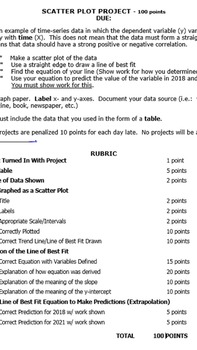
Students are asked to find an example of time-series data in which the dependent variable (y) varies linearly with time (X). The data should have a strong positive or negative correlation. Students will be asked to:
Make a scatter plot of the data.
Use a straight edge to draw a line of best fit.
Find the equation of the line where they must show work for how they determined this.
Use their equation to predict the value of the variable in 2012 and 2018.
A very detailed rubric is provided. 1 page document
Make a scatter plot of the data.
Use a straight edge to draw a line of best fit.
Find the equation of the line where they must show work for how they determined this.
Use their equation to predict the value of the variable in 2012 and 2018.
A very detailed rubric is provided. 1 page document
Total Pages
Answer Key
N/A
Teaching Duration
N/A
Report this resource to TPT
Reported resources will be reviewed by our team. Report this resource to let us know if this resource violates TPT’s content guidelines.


