Scatter Plots and Linear Regression For PDF, 7 Assignments + 3 Intros
- Zip
- Internet Activities
Description
Included in this zip folder are 13 PDF files. 7 are assignments, 1 is a reference, 3 are intro's and 2 are uploads for Google Classroom or similar site. A brief description of each:
The reference is a 1 page printable that defines:
1. x bar
2. y bar
3. y hat
4. least squares regression line
5. correlation coefficient
6. Independent and Dependent Variable
7. Positive and negative correlation
Into #1 is a 20 page file. The emphasis is scatter plots and limiting the number of tick marks to 5 on each axis.
Intro #2 is 33 page file. The emphasis is:
1. The line of best fit
2. Positive and negative correlation
3. Correlation strengths
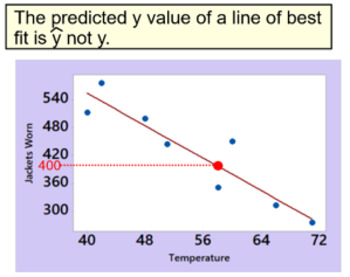
4. y vs y hat values
5. Least squares regression
Intro #3 is a 10 page file. The emphasis is using a TI 30 XS multi view calculator to find significant values.
Assignment A is a 1 page 6 question file where the student makes scatter plots of data and restricts their tick marks to 5 on each axis.
Assignment #1 is a 1 page 40 question file. For n=10, the student obtains values such as:
1. x-x bar
2. y- y bar
3. (x- x bar)^2
4. (x-x bar)(y- y bar)
The students finds the summation of these values as well in a table. This is socrative ready or can be printed.
Assignment #2 is like #1
Assignment #3 is like #1
Assignment #4 is a 1 page 24 short answer and multiple choice file. The student recognizes positive and negative correlation, what is a strong and weak correlation, finds y values and y hat values from a model. This assignment is socrative ready or can be printed.
Assignment #6 is a 1 page 24 short answer and multiple choice file. The student recognizes positive and negative correlations and their strengths. The student also finds values from a table and y hat values making their own model.
Assignment #7 is like #6
The google classroom upload is all of these assignments and reference in 2 files. 1 with no solutions and 1 with the odd solutions. This is in the traditions of math text books which our great state no longer purchases. Thank you state department of ed.
Thank you for looking


