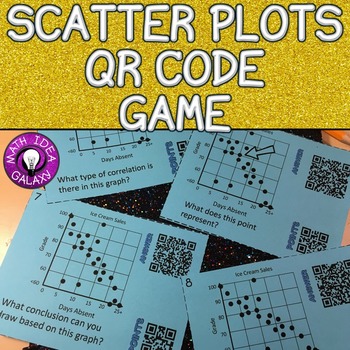
Scatter Plots Activity - QR Code Game
Idea Galaxy
6.8k Followers
Grade Levels
6th - 8th
Subjects
Resource Type
Standards
CCSS8.SP.A.1
Formats Included
- PDF
Pages
8 pages
Idea Galaxy
6.8k Followers
What educators are saying
I always love task cards because it quickly assesses a variety of skills and topics. It is often a great review tool to use before a test or quiz. My students enjoy it as well because they can get to work in groups.
Used this as part of a skills topic. Students found the resource very engaging and the instructions were clear and easy to follow.
Also included in
- This is a collection of games, activities, and notes that will engage your students in learning about scatter plots. This is the perfect addition to your class and will give students more practice with scatterplots and can be used for differentiation, centers and stations, homework and bellringers.Price $13.60Original Price $17.00Save $3.40
- This is a collection of 21 activities to help your students learn about and practice two-way tables, scatter plots, and slope intecept modeling that are part of the 8th grade math statistics and probability cluster in the CCSS. These are great for math centers and so much more fun than worksheets.Price $42.00Original Price $52.50Save $10.50
- This is a collection of more than 175 activities that will engage your students in learning pre-algebra and geometry concepts in 8th grade math. These activities can be used through out year for months of lessons and practice. You will find interactie notebook foldable notes, mazes, whole class kPrice $250.00Original Price $398.75Save $148.75
Description
This game will help your students analyze scatter plot graphs. They will have the opportunity to play cooperatively or to add a little healthy competition.
This resource includes:
-16 questions
-QR Codes
-Answer Key
-Teacher Directions
-Tips and variations
This resource includes:
-16 questions
-QR Codes
-Answer Key
-Teacher Directions
-Tips and variations
Total Pages
8 pages
Answer Key
Included
Teaching Duration
45 minutes
Last updated Jul 10th, 2016
Report this resource to TPT
Reported resources will be reviewed by our team. Report this resource to let us know if this resource violates TPT’s content guidelines.
Standards
to see state-specific standards (only available in the US).
CCSS8.SP.A.1
Construct and interpret scatter plots for bivariate measurement data to investigate patterns of association between two quantities. Describe patterns such as clustering, outliers, positive or negative association, linear association, and nonlinear association.


