TPT
Total:
$0.00

STEM Centers Weather and Climate | STEM Stations Science Concepts

Rated 5 out of 5, based on 1 reviews
5.0 (1 rating)
;
Design Education
520 Followers
Grade Levels
3rd - 4th
Resource Type
Standards
Formats Included
  • PDF
  • Internet Activities
Pages
46 pages
$3.20
List Price:
$4.00
You Save:
$0.80
$3.20
List Price:
$4.00
You Save:
$0.80
Share this resource
Report this resource to TPT
Design Education
520 Followers
Compatible with Digital Devices
The Teacher-Author has indicated that this resource can be used for device-based learning.

Description

Make teaching weather and climate fun with these engaging, hands-on STEM centers! This set includes 4 low-prep STEM stations perfect for exploring weather/climate skills and critical thinking. Quick and easy setup plus clear directions make these activities perfect for centers, extensions, or entire unit teaching!

Lead your students to discover concepts of climate and weather by exploring it on their own. Students will love researching science concepts through these fun STEM activities, and won't even realize how much they're learning!

Here's what you'll get:

  • 4 climate and weather activities perfect for centers or stations
  • Station instructions
  • Teaching suggestions
  • Printable student response sheets
  • Reference notes
  • Optional printables - material donation letters and rubrics

Your students will love being engaged in engineering discussions and exploring weather/climate concepts in real life.

Prep is quick and easy... Just print the student pages and you're ready for a fun and engaging class!

The 4 included stations are:

  1. Science - students will sort the weather vs. climate statements
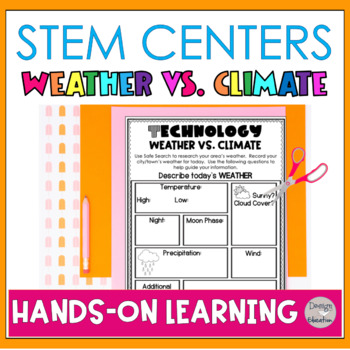
  2. Technology - students will research the weather in the students’ town
  3. Engineering - students select a location around the world and will build a shelter for the climate
  4. Math - students will create a bar and line graph based on the weather and climate in their town

Grab a free set of Engineering Posters here!

___________________________________

You may also like…

STEM Math Challenge Elapsed Time

STEM Challenges with Everyday Items

Engineering Journal

___________________________________

Copyright © Design Education

Permission to copy for single classroom use only.

Please purchase additional licenses if you intend to share this product.

Total Pages
46 pages
Answer Key
Included with rubric
Teaching Duration
N/A
Report this resource to TPT
Reported resources will be reviewed by our team. Report this resource to let us know if this resource violates TPT’s content guidelines.

Standards

to see state-specific standards (only available in the US).
Draw a scaled picture graph and a scaled bar graph to represent a data set with several categories. Solve one- and two-step “how many more” and “how many less” problems using information presented in scaled bar graphs. For example, draw a bar graph in which each square in the bar graph might represent 5 pets.
NGSS3-5-ETS1-3
Plan and carry out fair tests in which variables are controlled and failure points are considered to identify aspects of a model or prototype that can be improved.
NGSS3-ESS2-1
Represent data in tables and graphical displays to describe typical weather conditions expected during a particular season. Examples of data could include average temperature, precipitation, and wind direction. Assessment of graphical displays is limited to pictographs and bar graphs. Assessment does not include climate change.
NGSS3-5-ETS1-1
Define a simple design problem reflecting a need or a want that includes specified criteria for success and constraints on materials, time, or cost.
NGSS3-ESS2-2
Obtain and combine information to describe climates in different regions of the world.

Reviews

Questions & Answers

520 Followers