SAT Prep: Charts, Tables, and Graphs using U.S. Census Data Study
History The Doctor K Way
36 Followers
Grade Levels
9th - 12th
Subjects
Resource Type
Formats Included
- Word Document File
- Webquests
Pages
8 pages
History The Doctor K Way
36 Followers
Compatible with Digital Devices
The Teacher-Author has indicated that this resource can be used for device-based learning.
Description
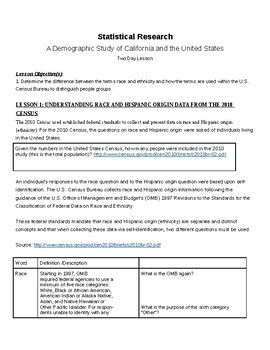
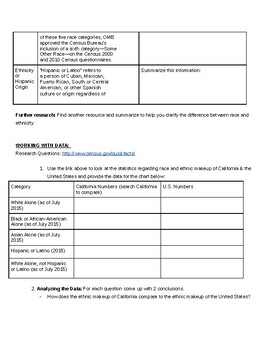
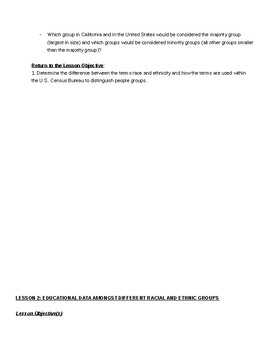
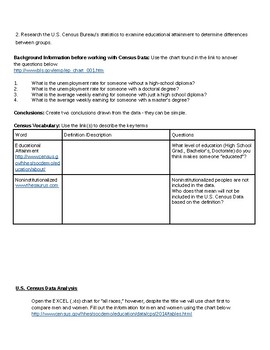
This lesson uses data from the 2010 U.S. Census to allow students to access numbers and data in a social science classroom. The lesson is a 2 day mini-unit centered on working with charts, graphs, and tables (serves extremely well for SAT and ACT prep). This cross-curricular lesson draws meaningful parallels between math and social science, and the necessity of bringing these subjects together. The lesson uses a comparative look at Census data for California and the United States as a whole, but it can be adapted for any particular state's data. If you take the tables provided and put them in an excel or GoogleSheets format, the lesson can also be used to teach basic computation for those programs.
Total Pages
8 pages
Answer Key
N/A
Teaching Duration
2 days
Report this resource to TPT
Reported resources will be reviewed by our team. Report this resource to let us know if this resource violates TPT’s content guidelines.


