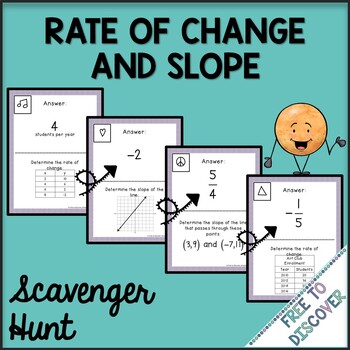
Rate of Change and Slope Scavenger Hunt Activity
What educators are saying
Also included in
- "The lessons are so much more clearly written than the lessons in our textbook!" Teachers around the country are raving about this unique curriculum. This eighth grade math curriculum bundle contains a full differentiated curriculum and all 8th grade math activities. It consists of differentiated nPrice $297.00Original Price $556.75Save $259.75
- In these functions activities, students will practice defining, comparing, evaluating, and analyzing linear functions. Students will understand that for each input there is exactly one output, what makes a function linear versus nonlinear, the meaning of rate of change and initial values given realPrice $25.00Original Price $34.50Save $9.50
- This bundle includes all middle school math scavenger hunts. Scavenger hunts are engaging activities that facilitate math practice in an interactive, fun way!Teachers love scavenger hunts because they:⭐ increase engagement⭐ skyrocket motivation⭐ encourage collaboration⭐ promote masteryStudents lovePrice $85.00Original Price $152.75Save $67.75
Description
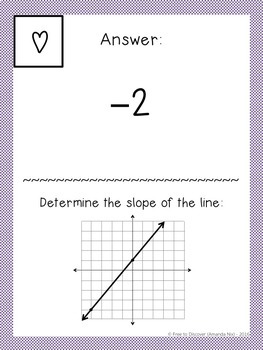
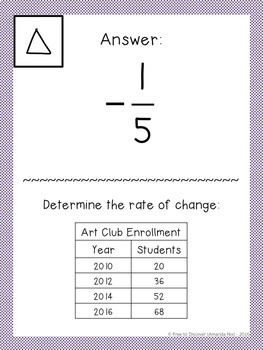
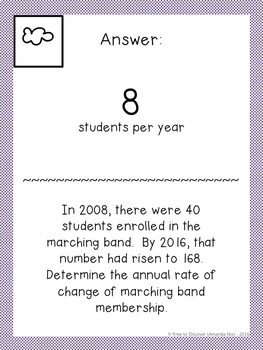
Practicing rate of change has never been more fun! Get students out of their seats and determining rate of change and slope with this interactive scavenger hunt. Students will practice determining rate of change given a table, graph, pair of coordinates, or verbal scenario. Half of the problems are strictly mathematical and half involve a real scenario. All of the real scenarios involve "students per year" so that the labels are not a giveaway to the answer, yet the importance of labeling the rate is emphasized. There are 12 practice problems included in the activity. Students begin in different locations around the room and use their answers to find the next problem they must complete. The scavenger hunt is over when students complete all 12 problems and end where they began.
Included in this product:
-12 scavenger hunt stations
-Answer Key
-Student Workspace
-Teacher's Guide with CCSS, objectives, materials, and procedure
You might also like:
Rate of Change and Slope Task Cards
Slope of a Line Differentiated Notes and Practice
Road Trip! Modeling and Analyzing Linear Relationships
Task Cards: Determining the Rate of Change and Initial Value of Linear Functions
Growth Rates: Comparing Rate of Change in Non-Proportional Relationships
Math War: A Game to Practice Comparing Rate of Change Non-Proportional Edition
Copyright Information and Terms of Use:
The purchase of this product entitles a single user to reproduce the resource for classroom use only. Discounted additional licenses can be purchased if you wish to share with other teachers. The product is for educational use only. The product may not be used for commercial purposes or resold in any form. It cannot be uploaded to the Internet, with the exception of password-protected school websites.
© Free to Discover (Amanda Nix)


